Binary Coverage Analysis Without Source Code: INT3 Breakpoint Traps and Hardware Tracing in Practice
Binary Coverage Analysis Without Sourc…
How to collect code coverage from binaries without source code using INT3 traps, Intel PT, and AFL bitmaps.
When source code is unavailable, traditional compiler-based coverage instrumentation fails entirely. This article explores three practical techniques for binary-level coverage collection: INT3 one-shot breakpoints, memory page protection manipulation, and AFL-style bitmap tracking. It also covers Intel PT hardware tracing and discusses real-world applications in fuzzing, firmware security auditing, and sourceless performance profiling.
Can We Do Coverage Analysis Without Source Code?
Code coverage is one of the core metrics in software testing, measuring how many code paths are exercised by a test suite. Its key dimensions include statement coverage, branch coverage, path coverage, and MC/DC (Modified Condition/Decision Coverage). Typically, developers can easily collect coverage data at the source level using compiler instrumentation — modern compilers like GCC (gcov) and LLVM (SanitizerCoverage) insert counter calls into every basic block (the smallest sequence of instructions in a control flow graph that executes sequentially without branching) at compile time, generating coverage reports renderable by visualization tools like lcov. But when faced with binary programs without source code — whether for reverse engineering, fuzzing, or malware analysis — traditional approaches break down entirely.
This article explores how to implement code coverage collection at the pure binary level using "unconventional" — even seemingly "wrong" — techniques. These counterintuitive approaches reveal possibilities in low-level system mechanics that are often overlooked.
Three Core Challenges of Binary Coverage
No Instrumentation Entry Point
Source-level coverage relies on compile-time instrumentation — the compiler injects counting logic into every basic block. For an already-compiled binary, there's no going back to the compilation stage, so monitoring logic must be re-injected via runtime dynamic instrumentation or static binary rewriting.
The Performance vs. Precision Trade-off
Mainstream binary instrumentation tools like Intel PIN and DynamoRIO achieve fine-grained tracing through Dynamic Binary Translation (DBT) — translating original machine code into instrumented code at runtime and caching it for execution. The performance overhead from these tools comes from three main sources: re-translation costs on code cache misses, instruction bloat from instrumentation callbacks, and frequent table lookups due to the inability to statically predict indirect jumps. In real-world fuzzing benchmarks, PIN's throughput is typically 10 to 50 times lower than native execution. For high-throughput scenarios like fuzzing, which requires thousands of executions per second, this overhead is often unacceptable.
Hardware vs. Software Trade-offs
Modern approaches increasingly favor leveraging hardware features. Intel PT (Processor Trace) is a hardware tracing feature introduced by Intel with the Broadwell microarchitecture. It writes compressed encodings of conditional branch Taken/Not-Taken bits and indirect branch target addresses into a dedicated trace buffer in memory, with typical CPU overhead below 5%. Its core data packets consist of TNT packets (encoding consecutive conditional branch outcomes), TIP packets (recording indirect branch targets), and FUP packets (marking asynchronous events). Decoding requires static binary analysis to reconstruct complete control flow. However, Intel PT has strong platform dependencies — configuration in virtual machine environments is complex, and ARM platforms require CoreSight ETM as an alternative — making portability its primary bottleneck. Balancing portability against performance is the key design challenge for binary coverage solutions.
Three "Out-of-the-Box" Implementation Techniques
Technique 1: Exploiting Breakpoint Traps (INT3 Instruction)
One classic lightweight approach is to abuse software breakpoints (the INT3 instruction). INT3 (opcode 0xCC) is a single-byte interrupt instruction in the x86 architecture specifically designed for debuggers. When triggered, the CPU raises a #BP exception (Breakpoint Exception, exception vector 3), transferring control to the kernel's exception handler, which then notifies the debugger process via the debugging subsystem (Linux's ptrace, Windows's Debug API).
The concrete approach is to plant a breakpoint at the entry of each basic block: ① save the original byte at the target address; ② replace that byte with 0xCC using PTRACE_POKETEXT or WriteProcessMemory; ③ upon catching the SIGTRAP signal, record the hit and restore the original byte; ④ subsequent executions of the same address pass through with zero overhead. This "one-shot breakpoint" strategy captures complete coverage information while minimizing runtime overhead, and is the standard technique used by binary fuzzers like SyzBot and WinAFL to implement lightweight coverage.
Technique 2: Exploiting Memory Page Protection Attributes
Another clever approach is to manipulate the protection attributes of memory pages. Marking code pages as non-executable causes a page fault when the program attempts to execute them, allowing execution traces to be captured. This method operates at page granularity, which is relatively coarse, but it's simple to configure and remains useful in scenarios where precision requirements are low.
Technique 3: Shadow Memory and Lightweight Bitmap Marking
AFL (American Fuzzy Lop), released by Michał Zalewski in 2013, introduced a core innovation in its coverage model: elevating coverage granularity from basic blocks to "edges" — directed edges representing a jump from basic block A to basic block B — enabling it to distinguish execution paths with different loop iteration counts. AFL maintains a 64KB shared memory bitmap (__afl_area_ptr), where each edge maps to a bitmap index calculated as src_id XOR (dst_id >> 1), incrementing the corresponding byte on each hit. The fuzzer compares the bitmap after each execution against the historical set of "interesting paths": if a new byte becomes non-zero or an existing byte's count crosses a preset power-of-two threshold, the execution is deemed a new path and the input is added to the seed queue. This design — trading minimal memory (64KB) for path-distinguishing capability — has become an architectural reference for successor fuzzers like LibFuzzer and honggfuzz.
Real-World Applications
Coverage-Guided Fuzzing. Modern fuzzers almost universally rely on some form of binary coverage feedback. Without coverage data, a fuzzer cannot determine whether a given input explores new code paths, making intelligent mutation impossible.
Security Auditing of Closed-Source Software and Firmware. Security researchers analyzing commercial software or embedded firmware typically have no access to source code. Embedded scenarios are especially complex: architectures like ARM Cortex-M, MIPS, and RISC-V each have their own interrupt handling models, and x86-specific instructions like INT3 cannot be directly ported. Bare-metal environments lack system calls like ptrace, leaving JTAG/SWD debug probes or full emulation (e.g., QEMU+Avatar², Renode) as the only options for coverage collection. Binary coverage is the only viable means of measuring test completeness and locating uncovered dangerous code regions.
Performance Profiling Without Source Code. Coverage data can identify hot execution paths, providing data-driven support for targeted optimization work when source code is unavailable.
Conclusion: Constraints Breed Creativity
Binary coverage analysis without source code embodies a longstanding philosophy in systems security and low-level engineering: when the conventional path is blocked, engineers extract what they need from OS mechanisms, CPU features, and exception handling flows. INT3 breakpoints, page protection, bitmap tracing — these seemingly "wrong" approaches are often the real keys to breaking through technical deadlocks.
For practitioners in reverse engineering, vulnerability research, or systems security, understanding these low-level techniques has direct practical value — and also serves as an exercise in systems thinking. It reminds us that the exploration space beyond the specification is equally worth diving into.
Key Takeaways
Related articles
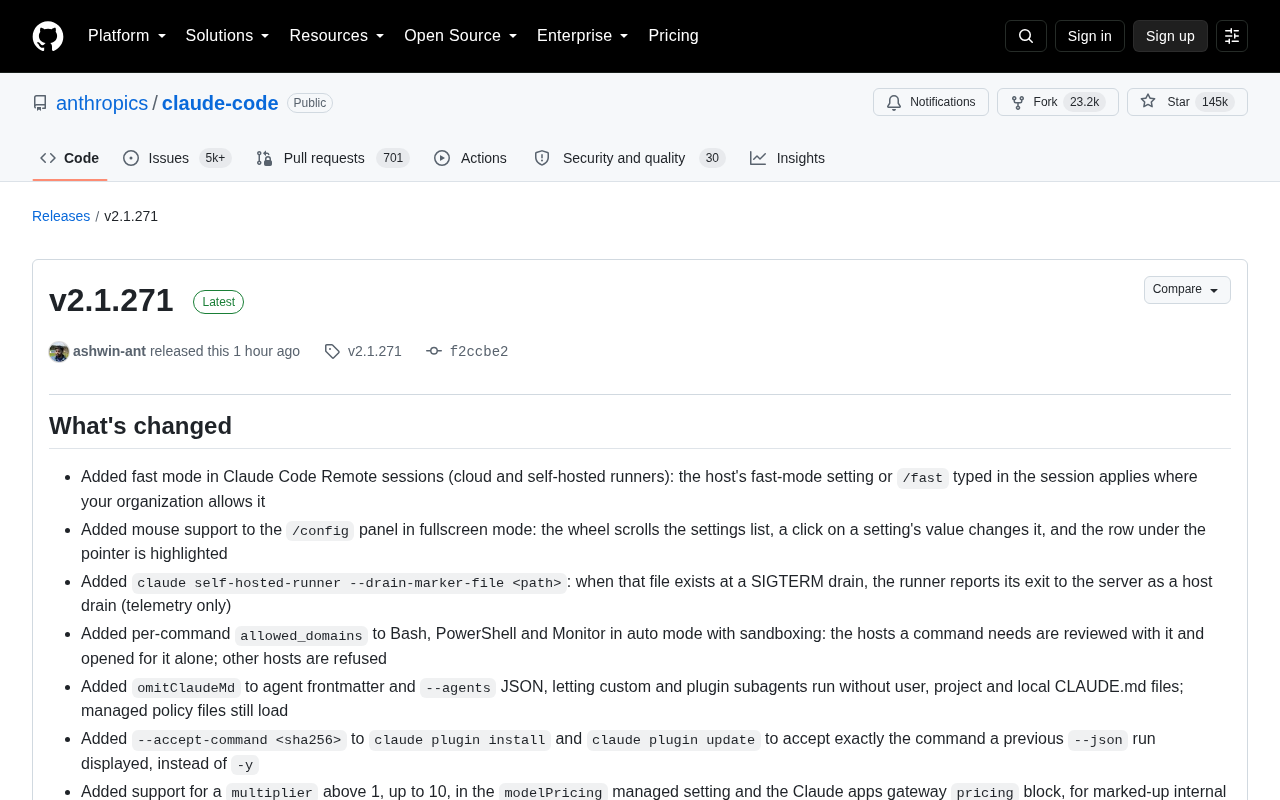
Claude Code v2.1.271 Update Deep Dive: Fast Mode, Sandbox Security, and Enterprise Improvements
Claude Code v2.1.271 adds fast mode for remote sessions, per-command sandbox network controls, enterprise policy fixes, MCP protocol improvements, and terminal/IDE enhancements.

AI Giants Collectively Hit the Brakes: Safety Protocol or Industry Cartel?
OpenAI, Anthropic, Google DeepMind, and SpaceX leaders agree to slow AI development. Is this a responsible safety pact — or an oligopolistic cartel in disguise?

Apple Home Gets AI Camera Features with iOS 27: Up to $60/Month
iOS 27 and tvOS 27 bring Apple Intelligence to Apple Home with AI video summaries for HomeKit Secure Video — but unlocking them costs up to $60/month via subscription.