Claude Opus 5.5 Error Spike: Officially Resolved, an 11-Minute Incident Retrospective
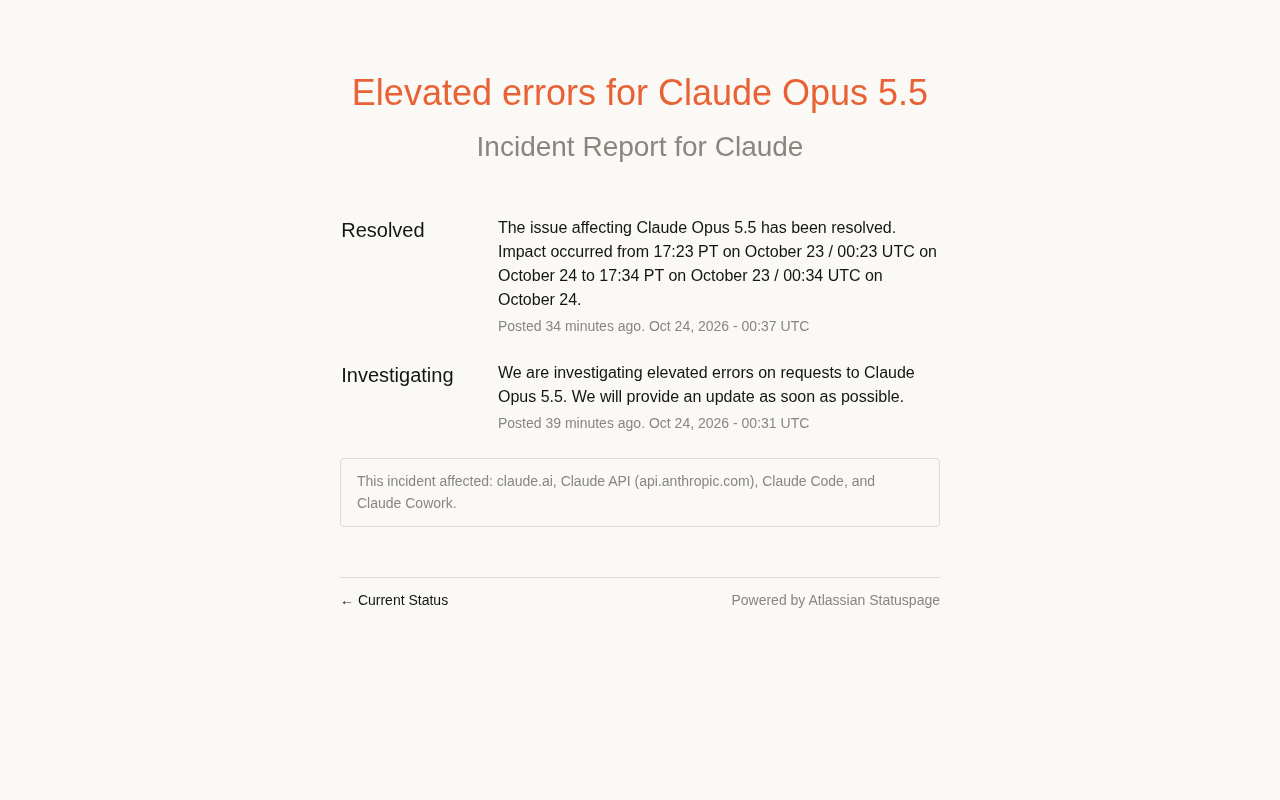
Claude Opus 5.5 experienced about 11 minutes of elevated request error rates, which the official team diagnosed and resolved within 6 minutes.
Claude Opus 5.5 experienced elevated request error rates from 17:23 to 17:34 Pacific Time on October 23. The official status page posted "Investigating" at 00:31 UTC and updated to "Resolved" 6 minutes later, with an actual impact window of about 11 minutes. Public information indicates the incident was limited to Opus 5.5 inference requests and did not affect other models or platform-level services. For developers, even a short-lived error rate spike can still trigger retry storms, queue backlog, and user-facing failures. The article recommends configuring backup models, exponential backoff retries, status page subscriptions, and circuit breaking with fallback, and emphasizes that monitoring should focus on error rate spikes and percentiles rather than just overall success rates.
Incident Overview: Abnormal Error Rates on Claude Opus 5.5
According to information published on the official status page, Claude Opus 5.5 experienced a short-lived spike in request error rates. At 00:31 UTC on October 24, the official team first posted an "Investigating" status, confirming they were looking into a surge in request errors affecting Claude Opus 5.5. About 6 minutes later, the status was updated to "Resolved," announcing the issue had been fixed.
Based on the timeline disclosed on the status page, the actual impact window was from 17:23 to 17:34 Pacific Time on October 23 (corresponding to 00:23 to 00:34 UTC on October 24), lasting approximately 11 minutes. This was a typical high-priority, short-duration incident: detected quickly, diagnosed quickly, and recovered quickly—but for production systems relying on this model, even a ten-plus-minute disruption can cause visible business fluctuations.
Incident Timeline and Official Response
Only 6 Minutes from "Investigating" to "Resolved"
The two updates on the official status page constitute the complete public record of this incident:
- 00:31 UTC: Posted "Investigating," indicating an ongoing investigation into elevated request error rates on Claude Opus 5.5, with a promise to provide updates as soon as possible.
- 00:37 UTC: Posted "Resolved," confirming the issue affecting Claude Opus 5.5 had been resolved, and providing the precise impact window: October 23, 17:23 PT to 17:34 PT (i.e., October 24, 00:23 UTC to 00:34 UTC).
You may not have noticed that the interval between "Investigating" and "Resolved" on the status page was only 6 minutes, while the actual impact window was 11 minutes. This means the official team responded quickly after the incident occurred and supplemented the impact scope description as soon as service was restored. For large language model API services, this disclosure rhythm of "confirm first, then retrospective" is relatively standard.
Scope of Impact: Limited to Opus 5.5 Requests
The official statement explicitly notes that what was affected were "requests to Claude Opus 5.5," meaning the elevated error rates occurred at the inference request level for that specific model. The status page did not mention broader platform failures, nor did it indicate whether other models or API endpoints were affected. Based on public information, this was a localized anomaly targeting a single model service, not a platform-wide incident.
What "Error Rate" Means in the Context of API Monitoring
Error rate typically refers to the proportion of requests returning error status codes (such as HTTP 5xx or model-level timeouts and rate limiting) out of total requests within a given time window. For large language model APIs, elevated error rates may stem from inference cluster overload, downstream dependency failures, regional network jitter, or anomalies in the model service itself. The official use of "elevated errors" rather than "outage" indicates that the error rate deviated from the normal baseline but the service was not completely unavailable. When interpreting status pages, teams should combine the error code distribution in their own monitoring (e.g., 429 rate limiting vs. 500 internal errors) to determine the nature of the failure, because different error types correspond to entirely different retry strategies and fallback plans.
Practical Impact on Developers and Recommendations
An 11-Minute Window Is Enough to Trigger Production Alerts
For teams that have integrated Claude Opus 5.5 into production environments, an 11-minute elevation in error rates is not a trivial matter. Common chain reactions include: retry storms causing queue backlog, upstream service timeouts, user-facing failure messages, and monitoring systems triggering PagerDuty-style alerts. If business logic lacks fallback handling for model call failures, even a short-lived incident can escalate into a user-perceivable service disruption.
Multi-Model Redundancy and Retry Strategies Remain Essential
This incident once again demonstrates that relying on a single model carries inherent risks. Engineering mitigation measures to consider include:
- Configure a backup model: Automatically switch to another available model when the Opus 5.5 error rate exceeds a threshold, ensuring core pathways remain uninterrupted.
- Exponential backoff retries: Use backoff retries with jitter for idempotent requests to avoid amplifying backend pressure through instantaneous retries.
- Subscribe to the official status page: Integrate the status page RSS or webhook into your alerting system to detect issues earlier than waiting for user complaints.
- Circuit breaking and fallback: Set circuit breaker thresholds for model calls; when triggered, serve cached results or simplify the workflow.
Exponential Backoff with Jitter
Exponential backoff is a retry strategy in which the wait time before each retry grows exponentially (e.g., 1s, 2s, 4s, 8s), with a maximum retry count and cap to prevent clients from continuously hammering the backend before service recovery. Jitter adds a random amount to the wait time to prevent large numbers of clients from retrying synchronously at the same moment, creating a "retry storm." For large language model APIs, it is recommended to enable automatic retries only for idempotent requests (such as pure text generation that does not depend on session state), and to set independent timeout and interruption handling logic for streaming responses to avoid duplicate billing or context corruption caused by retries.
Circuit Breaker Pattern
A circuit breaker is a protective design: when the failure rate for a downstream service (here, the Opus 5.5 API) exceeds a threshold, the circuit breaker transitions from "closed" to "open," and subsequent requests fail fast or take a fallback path without actually calling the downstream service; after a cooldown period, it enters a "half-open" state, allowing a small number of probe requests through, and if successful, returns to the closed state. Circuit breakers prevent thread pools or connection pools from being exhausted during failures and buy time for switching to a backup model. When implementing, pay attention to tuning thresholds, cooldown windows, and half-open probe volumes to avoid being overly sensitive and misclassifying normal fluctuations as failures.
A Short Incident's Reflection on the Availability of LLM Services
The availability of large language model APIs is becoming a hard criterion for engineering teams when selecting services. An 11-minute incident itself is not uncommon; what truly deserves attention are three dimensions: transparency of incident disclosure, speed of recovery, and clarity in defining the scope of impact. In this incident, the official team provided an impact window accurate to the minute on the status page, which is valuable input for teams that need to perform incident attribution and SLA accounting.
Another easily overlooked point is the distinction between "elevated error rates" and "complete unavailability." The official wording was "elevated errors," indicating that not all requests failed, but that the failure proportion was higher than the normal level. This type of partial failure poses a greater challenge for monitoring: averages may look normal, but tail error rates have already affected some users. When setting up alerts, teams should focus on error rate percentiles and spike detection, not just overall success rates.
Frequently Asked Questions
Is Claude Opus 5.5 working normally now?
According to the latest update on the official status page, the issue has been resolved and service has been restored.
How long did this incident last?
The official impact window was from 17:23 to 17:34 Pacific Time on October 23, approximately 11 minutes.
Were other Claude models affected?
Public status information only mentions elevated request error rates on Claude Opus 5.5 and does not indicate that other models were affected.
Related articles
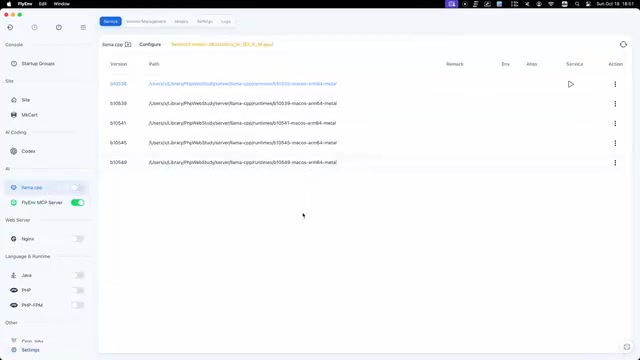
FlyEnv Plugin Review: Visually Running llama.cpp and Managing GGUF Models
FlyEnv launches the official llama.cpp plugin with side-by-side Metal runtime management, public GGUF repository indexing with file type labels, and visual configuration of context, threads, and GPU layers—saving templates and speculative decoding with each model for one-click local LLM inference.
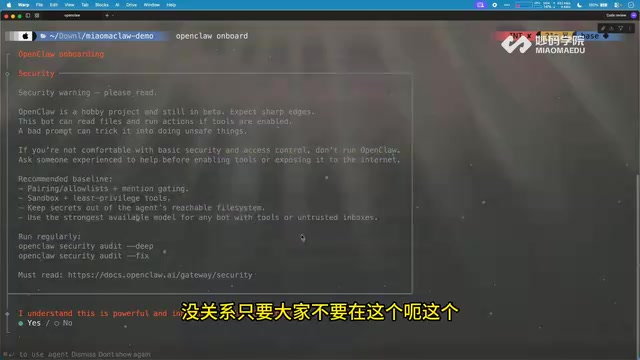
How Can Frontend Developers Advance into AI Agent Development? Deconstructing System-Level Agent Architecture from OpenClaw
Starting from the OpenClaw demo in a Bilibili open class, this article breaks down the three-layer architecture and universal formula of system-level AI agents, and analyzes the path for frontend developers to enter agent development based on TypeScript, including plugin-based design and security/memory layer challenges, with an interview answer framework.

WorkBuddy in Action: How AI Agents Automate Batch File Conversion and Archiving
Bilibili creator Teacher Shanyao tests WorkBuddy vs. Doubao on batch file conversion, showing how AI Agents move from "giving solutions" to "direct execution," with a full workflow and credit cost reference.