Claude Platform Usage Data Error Incident Analysis

platform.claude.com usage data error for ~8 hours, core API unaffected, exposing usage visibility and service availability as independent reliability dimensions.
Anthropic's developer platform platform.claude.com experienced an error incident affecting the Usage page, Rate limits page, and Admin API usage reporting, lasting approximately 8 hours from Investigating to Monitoring. The official team repeatedly emphasized that core API requests and functionality were unaffected, and noted after mitigation that usage data from the most recent ~30 minutes might still be delayed. The analysis suggests this reflects a decoupled design between the usage data display layer and the API service layer, and that developers should not rely on the platform dashboard as their sole monitoring source. Recommendations include building an independent usage ledger on the application side, collecting rate limit response headers, and subscribing to official status page notifications to address similar monitoring blind spots.
Incident Overview
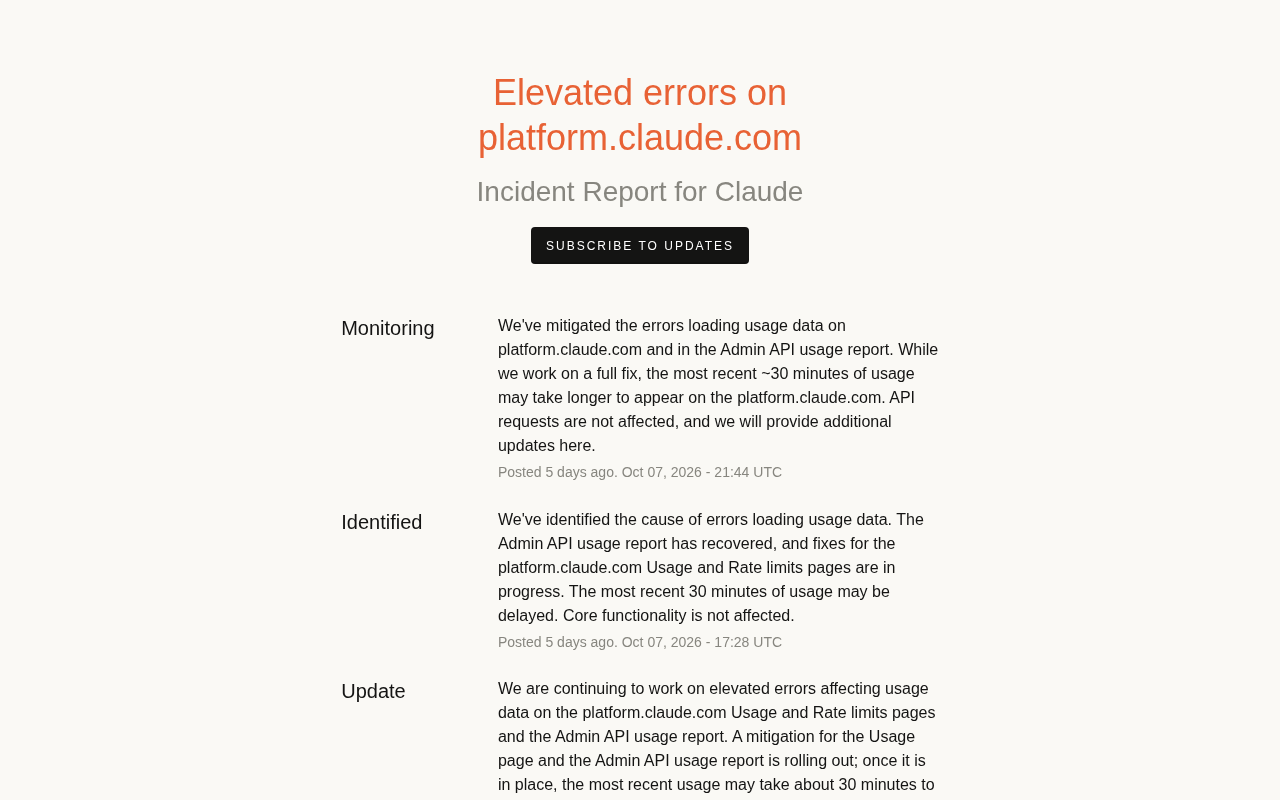
Anthropic's developer platform platform.claude.com experienced an error incident affecting usage data display. According to the official status page announcement, the incident primarily affected the platform's Usage page, Rate limits page, and Admin API usage reporting. The official announcement repeatedly emphasized: Core functionality is not affected, API requests are operating normally.
The incident progressed from "Investigating" to "Identified" to "Monitoring," with the entire handling process lasting approximately 8 hours. For developers building products on the Claude API, this type of incident is worth paying attention to—it reveals an often-overlooked problem: when the API itself is fine but usage data is delayed, how should teams respond?
Incident Timeline and Resolution Process
From Investigation to Identification: About 3 Hours
According to status page records, the platform first posted an "Investigating" status at UTC 13:25, indicating they were looking into errors affecting the Usage page and Admin API usage reporting. The initial assessment was that core functionality was not affected.
By UTC 16:36, the official team posted an "Update" stating that mitigation measures were being gradually deployed. An important detail was provided at this point: once mitigation measures were in place, recent usage data might take approximately 30 minutes to appear. This meant that even after system recovery, the data dashboard would not update immediately.
At UTC 17:28, the status was upgraded to "Identified," with the official team confirming they had found the root cause of the error. Admin API usage reporting recovered first, while fixes to the Usage and Rate limits pages on platform.claude.com were still in progress.
Mitigation and Monitoring: Data Delays Persist
At UTC 21:44, the official team updated the status to "Monitoring," announcing that errors in platform.claude.com and Admin API usage reporting had been mitigated. However, they candidly noted that before a complete fix, usage data from the most recent ~30 minutes might experience longer delays on platform.claude.com.
This statement indicated that although the errors themselves had been brought under control, recovery of the data pipeline was not instantaneous. For teams requiring precise usage monitoring, data within this time window could be incomplete.
Why Core Functionality Was Not Affected
The most notable aspect of this incident is that API requests were not impacted. In announcements at multiple time points, the official team explicitly stated "Core functionality is not affected" and "API requests are not affected."
From an architectural perspective, this suggests a possible decoupled design between the usage data display layer and the API service layer. Developers calling the Claude API for inference, generation, and other operations rely on the core service pathway, while usage statistics and rate limit displays go through a separate data aggregation and display pipeline. When the latter fails, the former can still operate normally.
This decoupling is intentional from an engineering standpoint—it ensures that even if the monitoring dashboard goes down, the business itself won't be interrupted. Conversely, however, it also means developers cannot fully rely on the platform dashboard to determine whether the service is available.
Control plane and data plane are key concepts for understanding this type of decoupling. In cloud service architecture, the control plane handles configuration, monitoring, billing, and policy distribution, while the data plane directly carries user business requests. Anthropic's API inference service belongs to the data plane, while the Usage page, Rate limits display, and Admin API usage reporting belong to the control plane. The availability targets for the two are typically different: the data plane pursues high availability and low latency, while the control plane allows for brief delays or degradation. The industry-standard approach is to have the control plane asynchronously consume log streams from the data plane, so when the aggregation pipeline fails, business requests can still complete normally—only visibility is impaired. This also explains why the official team could repeatedly emphasize that core functionality was unaffected—this is not a coincidence, but rather an inevitable result of architectural layering.
Practical Impact and Recommendations for Developers
Monitoring Blind Spots Caused by Usage Delays
For scenarios involving usage-based billing or capacity planning dependent on rate limits, a 30-minute data delay is not trivial. If your system operates near the rate limit while dashboard data lags, it could lead to misjudgment—you might think there's still headroom when you've actually hit the limit, or you might think you've exceeded the limit when there's actually plenty of quota remaining.
Rate Limit Headers are metadata attached by the server to each API response, typically including fields such as remaining requests, remaining tokens, and reset time. For example, the Anthropic API returns headers like anthropic-ratelimit-requests-remaining and anthropic-ratelimit-tokens-remaining. Compared to platform dashboards, these response headers are request-level real-time data that do not pass through asynchronous aggregation pipelines, and therefore were not affected by the delays in this incident. Developers can intercept and record these headers on the client side to build more timely and granular rate monitoring than dashboards provide. It's worth noting that response headers reflect the remaining quota at the moment of a single request; if a global view is needed, aggregation statistics should still be performed on the application side.
The Necessity of Building Independent Monitoring
This incident provides a clear takeaway: Do not rely on the platform dashboard as your sole source of usage monitoring. More robust approaches include:
- Recording your own API call counts and token consumption on the application side to build an independent usage ledger
- Collecting and alerting on rate limit-related response headers returned by the API
- Subscribing to official status page updates to learn about similar incidents as soon as possible
The official team promised in their announcement to "will provide additional updates here," indicating that the status page remains the primary channel for authoritative information. Incorporating it into your team's monitoring notification system can help quickly assess the scope of impact when similar incidents occur.
Transparency Observations on Incident Handling
Judging from the wording of the announcements, Anthropic's communication during this incident was relatively pragmatic. Each stage clearly distinguished between "what was affected" and "what was not affected," and provided specific expected delay times (approximately 30 minutes). This level of granularity in communication is more helpful for developers making decisions than a vague "we're working on a fix."
However, the official team did not disclose the specific technical root cause of this error, only stating that "the cause has been identified." For platform users, knowing whether the cause could recur and whether preventive measures are in place would be more valuable than simply knowing it has been "fixed."
Summary
This platform.claude.com usage data error incident was essentially a display layer failure rather than a service layer failure. Its handling process was clear and communication was timely, but it also exposed a reality: the visibility of usage data and the availability of APIs are two independent reliability dimensions. For teams integrating Claude into production environments, building a usage monitoring system that doesn't depend on a single dashboard is the most direct action item from this incident.
One-line Summary
platform.claude.com usage data error lasted about 8 hours, core API unaffected, exposing usage visibility and service availability as independent reliability dimensions.
Paragraph Summary
Anthropic's developer platform platform.claude.com experienced an error incident affecting the Usage page, Rate limits page, and Admin API usage reporting, lasting approximately 8 hours from Investigating to Monitoring. The official team repeatedly emphasized that core API requests and functionality were unaffected, and noted after mitigation that usage data from the most recent ~30 minutes might still be delayed. The analysis suggests this reflects a decoupled design between the usage data display layer and the API service layer, and that developers should not rely on the platform dashboard as their sole monitoring source. Recommendations include building an independent usage ledger on the application side, collecting rate limit response headers, and subscribing to official status page notifications to address similar monitoring blind spots.
Related articles

GitHub Daily · October 16: The Agent Skills Ecosystem Explodes
GitHub Daily Oct 16: 8 of 13 trending projects tied to AI agent skill systems. obra/superpowers gains 897 stars in a day, while Anthropic and Cursor launch official plugin directories.

Hands-On with Gemini 4 Argon: Building an AI Agent That Finds Sponsors Automatically
A YouTube creator built an AI agent with Gemini 4 Argon and Zapier that auto-watches peer videos to find sponsors, locate contact emails, and draft outreach. Argon tops Zapier's benchmark at 51.3%, with video analysis costing ~7 cents.

n8n Static Data vs Execution Data: Key Differences and Practical Usage
What's the difference between n8n workflow static data and execution data? This article uses the analogy of a persistent notebook and scratch paper to clarify their lifecycles, scopes, and practical choices, with a comparison table and common pitfalls to help you write automation flows that are reliable across runs.