CLIC Framework: Decoding LLM Programming Behavior Differences Through Token Frequency

CLIC uses token frequency and decision trees to reveal LLM coding behavior differences beyond performance metrics.
As LLM performance metrics like pass@k approach saturation, CLIC offers a new angle: representing code as token frequency vectors and training interpretable decision trees to distinguish models' code collections. Two new metrics — robustness (depth and breadth of differences) and concentration (whether differences center on few tokens) — enable quantitative behavioral characterization. An interactive visualization system supports multi-scale exploration from global overview to specific token contexts. Case studies across 10 LLMs and 22 Kaggle tasks yield actionable insights for model selection and prompt engineering.
When Performance Metrics Fall Short: Distinguishing LLMs by Coding Style
Evaluating large language models (LLMs) on programming tasks has long relied on performance metrics like pass@k. However, as model capabilities advance rapidly, many models can already meet basic performance thresholds — making it increasingly hard to differentiate them by scores alone. When every model can "get the answer right," a deeper question emerges: How do these models actually behave differently when writing code?
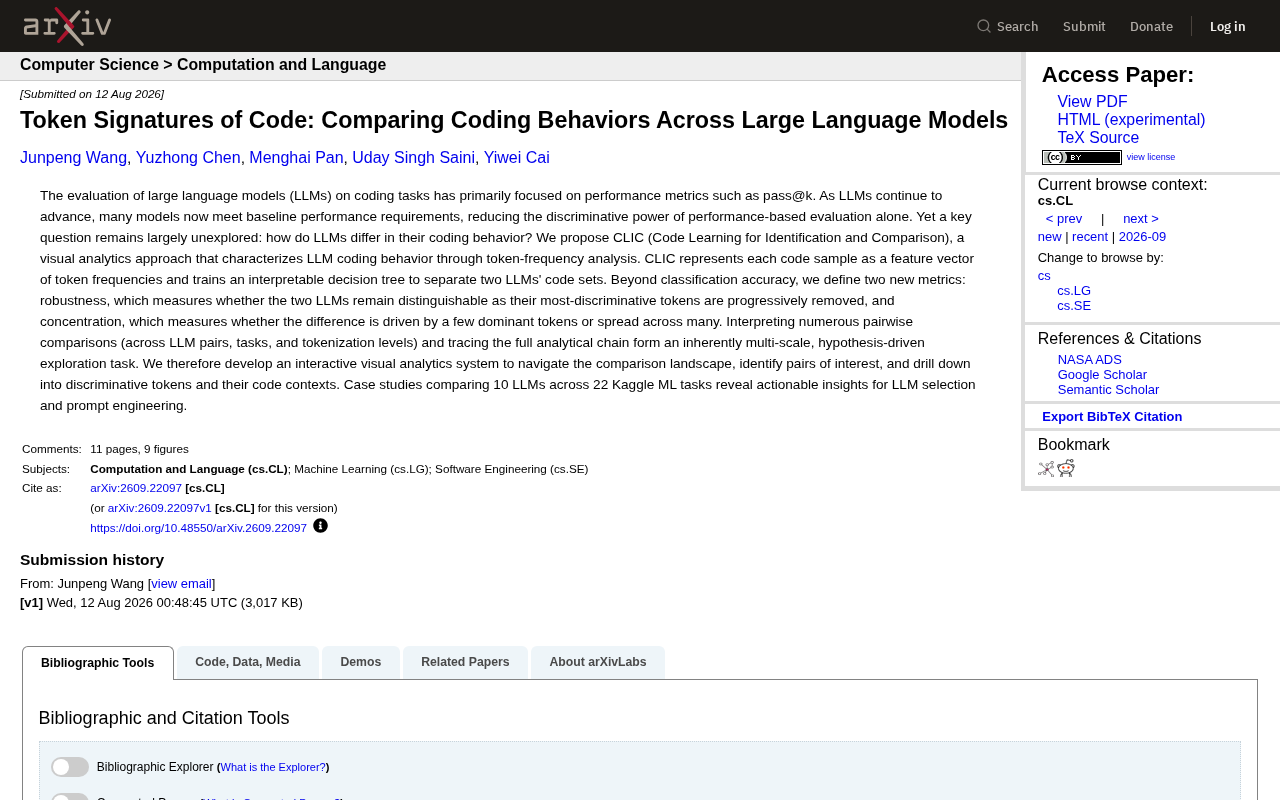
A new paper on arXiv introduces CLIC (Code Learning for Identification and Comparison), a visual analytics method that attempts to characterize the behavioral differences between LLMs through the "token signatures" of generated code. This is a noteworthy research angle — rather than treating models as black boxes that simply output right or wrong answers, it seeks to decode the statistical patterns underlying each model's coding style.
CLIC's Core Idea: Token Frequency as a Behavioral Fingerprint
CLIC's technical approach is straightforward yet effective. It represents each code sample as a feature vector of token frequencies — essentially capturing how often each type of token appears in the code. The system then trains an interpretable decision tree to distinguish between the code collections produced by two different LLMs.
Choosing a decision tree over more complex black-box classifiers is a key design decision in this work. Decision trees are inherently interpretable, clearly revealing which tokens make two models' code distinguishable. This "visible" classification logic forms the foundation for understanding behavioral differences — rather than simply reporting a classification accuracy number.
Two New Metrics: Robustness and Concentration
Beyond classification accuracy, CLIC defines two new measurement dimensions, which are a methodological highlight of the paper:
- Robustness: Measures whether two LLMs remain distinguishable as the most discriminative tokens are progressively removed. If models become indistinguishable after removing just a few key tokens, the differences are fragile; otherwise, the differences are deep and widespread.
- Concentration: Measures whether the differences between two models are driven by a handful of dominant tokens or spread across many tokens. High concentration means differences center on a few idiomatic patterns, while low concentration indicates a more systemic distinction in overall coding style.
These two metrics transform the binary question of "can we tell them apart?" into a quantitative characterization of the nature of those differences, making analytical conclusions far more interpretable.
pass@k is the most commonly used benchmark metric in code generation evaluation. It means: given k candidate answers generated for the same programming problem, a success is counted if at least one passes all test cases. k=1 measures single-attempt accuracy, while larger k reflects the model's "potential capability ceiling." This metric is widely adopted on standard benchmarks like HumanEval and MBPP, but its limitations have grown more apparent as overall model quality improves — when GPT-4-level models exceed 85% pass@1 on HumanEval, the score gaps between models have narrowed to the point where they can no longer serve as a primary decision criterion. This is precisely the context in which behavioral analysis methods like CLIC create value.
The specific workings of an interpretable decision tree here are worth explaining: given code sample collections from two models, each code snippet is converted into a vector where each dimension corresponds to the frequency of a particular token in that snippet. During training, the decision tree automatically selects the most discriminative tokens as split nodes, ultimately forming a chain of rules like "if the frequency of token X exceeds threshold t, the code is more likely from model A." Compared to neural network classifiers, each split node in a decision tree directly corresponds to a nameable token (such as lambda, square brackets from list comprehensions, specific library function names, etc.), allowing researchers to read the tree structure directly to understand the differences — rather than facing an opaque set of weight parameters.
Multi-Scale Interactive Visual Exploration
Interpreting a large number of pairwise comparison results is fundamentally a multi-scale, hypothesis-driven exploration task. Researchers need to navigate across different LLM pairings, different tasks, and different tokenization levels, while tracking complete analytical threads.
To support this, the authors developed an interactive visual analytics system for navigating the full comparison space: first identifying noteworthy model pairs at the macro level, then drilling down layer by layer to specific discriminative tokens and their surrounding code contexts. This analysis flow from overview to detail aligns with the classic "overview first, details on demand" principle in the visual analytics field, helping users quickly locate valuable findings amid vast comparisons.
"Overview first, details on demand" is a classic design principle in information visualization proposed by Ben Shneiderman in 1996. The full formulation is: "Overview first, zoom and filter, then details on demand." The core idea is that when facing complex datasets, users should first obtain a global overview to build situational awareness, then zoom and filter to focus on areas of interest, and finally access specific details as needed. CLIC's visualization system follows precisely this logic: the macro view presents a robustness/concentration heatmap of all pairwise model comparisons; users can then drill into the decision tree for a specific pair, and further retrieve contextual examples of target tokens in concrete code snippets — forming a complete analytical loop.
Empirical Study: 10 Models Across 22 Kaggle Tasks
To validate the method, the paper conducts a case study comparing 10 LLMs across 22 Kaggle machine learning tasks. This scale of cross-sectional comparison covers a rich combination of models and tasks.
The research team reports that these case analyses reveal insights with practical value for LLM selection and prompt engineering. In other words, understanding token-level behavioral differences between models isn't purely academic curiosity — it can directly guide engineering practice: when multiple models perform similarly, their coding habit differences may become an important differentiator; and understanding which code structures a model tends to generate also helps in designing more targeted prompts.
Significance and Limitations
CLIC's value lies in opening a new "behavioral analysis" dimension for LLM evaluation. As performance metrics approach saturation, characterizing model differences through coding style and token usage habits is a natural and necessary evolution. Interpretable decision trees combined with the two new metrics — robustness and concentration — give this analysis both a quantitative foundation and human readability.
To be objective: as a preprint just published, its conclusions are primarily based on the specific scenario of Kaggle machine learning tasks. Whether token frequency as a feature can comprehensively capture a model's "programming behavior," and how well it generalizes to general software engineering tasks, still awaits further validation. But as a methodological exploration, CLIC provides an insightful framework worth tracking for researchers and engineers focused on LLM evaluation and code generation.
Related articles

Apple HomeView Hands-On Review: Is the $300 Smart Home Hub Worth It?
Apple HomeView hands-on: a $300 smart home hub with facial recognition for quick account switching, but no App Store or voice recognition. Is the wall-mounted version worth it? Should you buy the first generation?

Meta Muse Wonder Launch: What It Means for Meta's Return to the Frontier AI Race
Meta releases Muse Wonder and WonderFull, benchmarks reach the frontier, community feedback is polarized. An in-depth look at Meta's return to the frontier AI race, its personal agent strategy, and Zuckerberg's different path.

Apple Home Smart Home Lineup Leaked: LG and Schneider Team Up, UWB Door Lock on Board
Apple Home ecosystem gains new LG and Schneider devices: UWB smart lock with proximity unlock, 2.5K dual-camera doorbell, privacy indoor camera, and AirPods-like seamless pairing.