Fine-Tuning Qwen on a Single RTX 3090: Why Isn't the Accuracy Gain Enough?

A Qwen fine-tuning experiment shows accuracy improving while NLL worsens, highlighting the importance of calibration and task-definition alignment.
Through a Qwen fine-tuning experiment on a single RTX 3090, this article reveals a common blind spot in fine-tuning evaluation: while development-set accuracy rose from 7/28 to 13/28, average negative log-likelihood (NLL) worsened from 2.215 to 3.916, indicating declining confidence in correct options. It breaks down an architecture built on a frozen backbone, a pointer decision head, and LoRA adapters, and documents engineering practices including Yelp label-question conflicts, training/evaluation data isolation, and checkpoint resumption.
On a single RTX 3090, an accuracy improvement is often treated as a sign of success when fine-tuning a large model. But one developer's Qwen fine-tuning experiment revealed an easily overlooked trap: while the number of correct answers on the development set rose from 7/28 to 13/28, the average negative log-likelihood (NLL) worsened from 2.215 to 3.916. This means the model guessed more answers correctly, but its confidence in the correct options actually declined. The finding points to a key blind spot in fine-tuning evaluation—accuracy is only half the story.
From Language Model to Candidate Scorer: Architecture Breakdown
The goal of the experiment was to have the model perform a class of "judgment" tasks: given a context, a question, and several candidate answers, return a probability distribution over each candidate. For example, determining whether a review is positive or negative, or routing a ticket to the billing, logistics, or returns team.
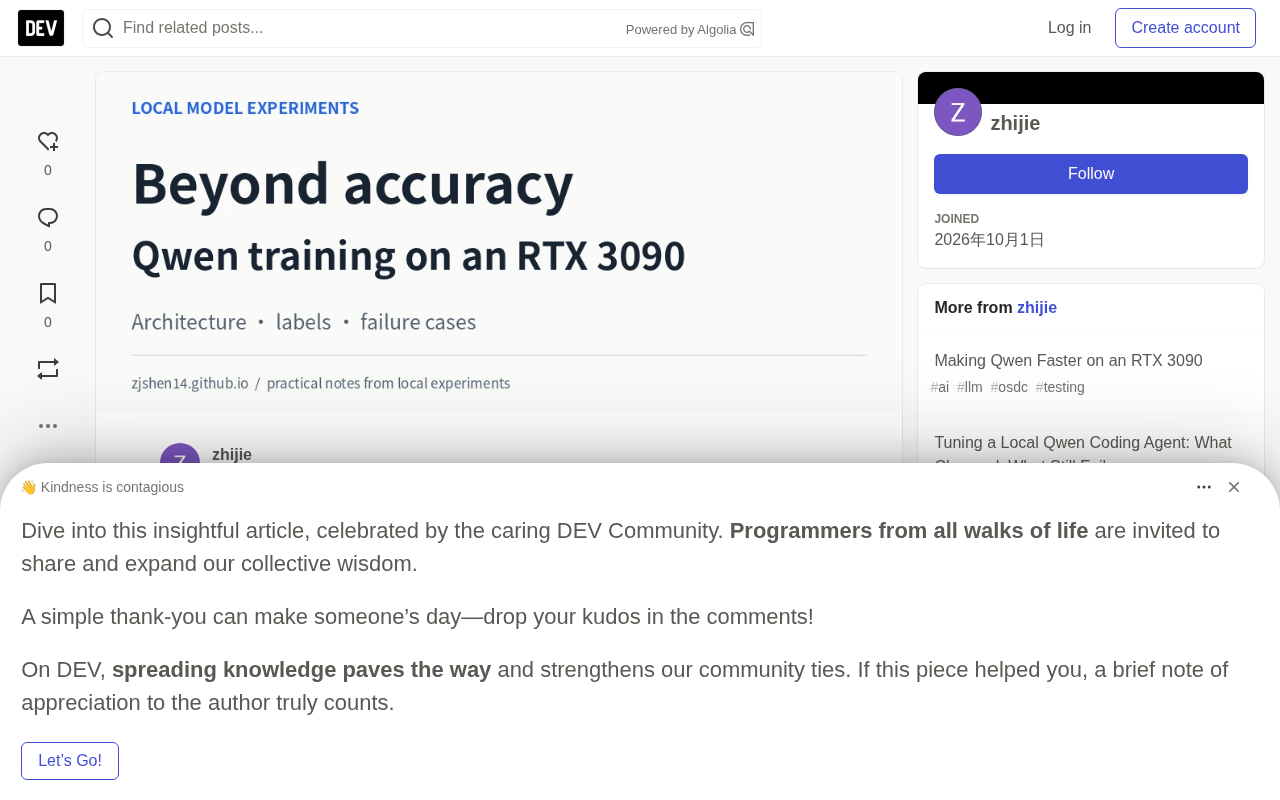
The architecture consists of three components. First, a frozen Qwen3.5 backbone reads the context, question, and candidate descriptions and outputs hidden-layer representations. Second, a pointer decision head takes the representations at the decision position and candidate positions and performs a projection match to obtain candidate scores, which are then converted into probabilities via softmax. Finally, LoRA adapters are inserted into the backbone and participate in training, while the original weights remain unchanged.
This design differs from a traditional fixed-category classification head. Candidate descriptions are part of the input directly, and the model must "read" the candidate content before scoring it, eliminating the step of generating a natural-language answer and then parsing it. The experiment started with two scales, Qwen3.5 0.8B and 4B, implemented on top of Jared Palmer's KEV training pipeline.
LoRA (Low-Rank Adaptation) is a parameter-efficient fine-tuning method that adapts a pretrained model to downstream tasks by injecting low-rank decomposition matrices alongside the weight matrices, while the original weights remain frozen. Specifically, for a weight matrix W, LoRA introduces two small matrices A and B such that the update ΔW = BA, where the ranks of A and B are much smaller than the dimensions of W. During training, only A and B are updated, greatly reducing trainable parameters and memory usage. At inference, BA can be merged back into W without adding extra latency. LoRA is particularly well suited for fine-tuning large models on consumer-grade GPUs; this experiment on an RTX 3090 relied on LoRA to make fine-tuning Qwen3.5 feasible.
Accuracy Up, NLL Worse: A Warning Signal
The researcher performed an initial training check on 24 records and 30 questions. The 0.8B model improved from 7/30 correct to 29/30 on the training questions, and the average NLL dropped from 2.1845 to 0.1030—the training path itself was effective.
But when switching to the 28 development questions, the situation became subtle: the number of correct answers rose from 7 to 13, yet NLL rose from 2.2153 to 3.9161. Accuracy only checks whether the highest-probability option is correct, while NLL also measures how much probability was assigned to the correct option. Suppose the probability of the correct answer drops from 0.4 to 0.001—both count as incorrect predictions, but the latter incurs a much larger NLL penalty.
This separation indicates that the model became more "confidently wrong" on some questions, or its confidence in the correct answers dropped significantly. The researcher noted that looking only at aggregate tables cannot pinpoint which questions caused this change. For applications that need probabilities to decide whether to act, calibration checks are equally indispensable—in judgments where the model gives about 80% confidence, are about 80% actually correct? Softmax only guarantees that probabilities sum to one; it does not guarantee that the probabilities mean what they claim.
Negative log-likelihood (NLL) is a common metric for measuring the quality of probability predictions in classification tasks, defined as the negative log of the predicted probability for the correct class: NLL = -log(p_correct). When the predicted probability of the correct class approaches 1, NLL approaches 0; when the probability approaches 0, NLL increases sharply. Unlike accuracy, which only cares about "whether the highest-probability class equals the correct answer," NLL is sensitive to the confidence the model assigns to the correct class. A model may have high accuracy but poor NLL because its confidence in correct answers is generally low. Conversely, a model may assign extremely low confidence to a few samples, driving up the average NLL. Therefore, using NLL together with accuracy provides a more comprehensive picture of the model's calibration state and prediction reliability.
Calibration refers to the consistency between the confidence a model outputs and its actual accuracy rate. A well-calibrated model should be correct about 80% of the time in predictions where it claims 80% confidence. The softmax function only guarantees that output probabilities sum to 1; it does not guarantee that these probabilities have an accurate frequency interpretation. During fine-tuning, a model may become overconfident (high confidence but high error rate) or underconfident. Calibration evaluation is usually quantified through reliability diagrams or expected calibration error (ECE). For applications that rely on probability thresholds for decisions (such as automatic routing or risk control), calibration matters more than raw accuracy, because wrong confidence leads to wrong actions.
Labels and Questions Mismatched: Correct Data Format Does Not Mean Correct Task
Before scaling up training, the researcher reviewed the Yelp review task in the mixed data. A fundamental problem was found: the binary labels came from a star-rating threshold, but the question asked, "Based only on the review text, is the reviewer clearly positive overall?"
These two do not necessarily express the same judgment. A fictional four-star review reads: "The food came out fast, but it was disappointing. Overall, I wouldn't recommend it." Under the star rule it maps to "yes," but by the text standard it should be judged "no." The model therefore received contradictory instructions and supervision signals.
The research team redefined explicit criteria: use only the provided text; clearly positive is "yes"; clearly negative, or substantially mixed with no clearly positive judgment, is "no"; insufficient information or truncation is set aside. The annotation package hid the original star ratings and old labels, and used model-assisted annotation with cross-checking. In the end, 38 related questions were excluded from supervision.
The value of this lesson is that valid JSON, acceptable input length, and in-range labels cannot reveal contradictions in the task definition. Training a few more epochs also cannot resolve the fundamental conflict between labels and questions.
Aligning Training and Evaluation: Engineering Practices for Data Isolation
In addition to fixing Yelp labels, structural checks, overlap screening, and semantic review isolated 56 records involving near-duplicate risk, unresolved ambiguity, and label conflicts. After the fixes, training used 12,520 records and 15,476 questions, with versions saved separately and accompanied by checksums.
Evaluation also needs to follow the revised task definition. Historical star labels cannot evaluate the new text-based questions, so the researcher built a 194-record development set based on the same text standard. Development data is used only for model checks and approach comparisons, calibration data is used for probability adjustment, and the final test is used for confirmation after the approach is fixed—the three uses are strictly separated. The training entry point uses an explicit source whitelist and rejects any mixing in of development data.
This isolation makes comparisons more meaningful, but screening cannot exclude all semantic overlap or pretraining exposure. Agreement between two model-assisted reviews does not equal independent human ground truth, and setting aside difficult cases also means some thorny situations are not included in the reported scores.
Comparison of the Two Training Versions and Their Limitations
After the fixes, the researcher retrained the 0.8B (B1) and 4B (B2) versions from Base, using the same fixed data and two epochs, with learning rates of 0.0001 and 0.00005 respectively.
On the 194 Yelp text judgments, B1 was correct on 184 and B2 on 192; the average NLL was 0.09620 and 0.04024 respectively. On the 1,184 historical multi-task questions, B1 was correct on 951 and B2 on 1,033, with NLL of 0.60133 and 0.46749 respectively. B2 was superior on both metrics.
However, the researcher explicitly warned: this is a comparison between two training recipes, without an untrained control group on the same dataset, so it is impossible to quantify the gain from fine-tuning itself or confirm whether general capabilities were retained. Another slice, closer to the risk of automated decision-making, showed: B1 made 181 predictions with confidence no lower than 0.9, of which 1 was wrong; B2 made 188, of which 2 were wrong. The sample size is small and the covered subsets differ, but this shows that a better average does not automatically mean fewer high-confidence errors, and 0.9 is not an off-the-shelf production threshold.
Training Resumption: Long Runs Need True Checkpoint Resumption
Moving from micro-experiments to long training runs requires another engineering capability: training resumption. Loading only the LoRA and readout weights allows continued prediction, but to continue the same training process, optimizer state, learning-rate progress, random state, and data position are also needed.
After adjusting determinism settings on the actual CUDA path, the researcher compared an uninterrupted training run with one that was terminated midway and then resumed. After both completed 8 optimizer updates, the trainable parameters and training state were bitwise identical, and the reload probabilities on the 30 check questions were also exactly the same. This verifies process-interruption recovery in a single-GPU environment, but does not cover retraining on different hardware or physical power-loss scenarios.
Checkpoint resumption requires saving not only model weights but also the complete training state, including optimizer state (such as Adam's momentum and variance), the progress of the learning-rate scheduler, the random number generator state, and the position of the data loader. Loading only weights restores inference capability but cannot precisely continue the training process, which may cause training dynamics to drift. Bitwise-identical resumption means that continuing from a checkpoint is numerically identical to uninterrupted training, which is crucial for long training runs because GPU memory limits or preemptible instances may interrupt training at any time. This experiment verified such deterministic recovery on a single GPU, but cross-hardware or power-loss scenarios still require additional handling.
The Next Questions Exposed by JevBench
Training, saving, and loading all worked normally, and there were both development set results and improvements. But how does the model perform on another set of real decisions? The researcher locally evaluated a fixed version of the public JevBench using the unchanged 4B version, including 231 downloadable questions.
All requests returned valid probability vectors with no input truncation. But when broken down by benchmark group, the gaps were obvious: the Easy group was 48/48, the Original group 69/72, and the Hard group only 53/111. The total score was 170/231, but 58 of the 61 errors came from the Hard group. Broken down further by task family, the correct rate for temporal and numerical questions was 0/15, and for long strategic judgments it was 4/19.
The overall score masked these weaknesses. Doing simple decisions well does not mean being reliable on date calculations, combined conditions, exception clauses, or evidence distributed across long documents. This points to a more specific direction for subsequent training: check task transformations, options, and labels item by item; add independently verifiable date calculations, rule combinations, and exception cases; and at the same time retain the training data and evaluation of the original tasks to test whether improving difficult problems comes at the cost of degrading mastered capabilities.
Length is a factor to investigate: the original 4B training configuration limited context to 384 tokens, while these long strategy contexts contain roughly 2,203–3,666 tokens. But longer inputs also all belonged to the Hard group, so length and difficulty are entangled, and the results cannot prove that length alone caused the failure.
The researcher emphasized that these are local diagnostics on public questions, not an official sealed evaluation or leaderboard ranking; differences between task groups also cannot establish training-induced performance regression. Quality optimization is still ongoing.
Takeaways for Practitioners
The value of this experiment lies not in the final score but in demonstrating a reproducible troubleshooting path. When accuracy rises while NLL worsens, you should check whether the labels actually answer the question itself; the development set and training set must be aligned according to the task definition; probability outputs need calibration evaluation; and group-level breakdowns of public benchmarks are more diagnostically valuable than total scores. For developers fine-tuning on consumer-grade GPUs, these lessons are more worthy of attention than any single metric. The model, data, and reproduction materials have been released on Hugging Face, including LoRA adapters, the decision readout, the loader, and training configurations.
Related articles

WorkBuddy Full Tutorial: Build an AI Office Automation Agent from Scratch
A complete WorkBuddy tutorial: installation, three working modes, multimodal picture book video practice, expert team agent building, and workflow configuration for low-cost AI office automation.

WorkBuddy Agent Complete Guide: From Beginner to Automation in 7 Days
Based on Bilibili's 256-episode WorkBuddy masterclass, this systematically breaks down Tencent's AI office workbench core capabilities: Agent principles, Skill encapsulation, cross-platform connectors, scheduled automation, knowledge bases, and zero-code development, with learning path recommendations.

8 AI Accounts, 7 Failed: An Honest Review of Using AI to Get Work Done
Only 1 of 8 AI-run Bilibili accounts succeeded. We break down the real difference between "performing AI" and "using AI to get work done."