From 1000x FLOPs to 6x Latency: A Hands-On Breakdown of GPT-2 KV Cache

Developer hand-implements GPT-2 KV cache; FLOPs drop 1000x while latency only drops 6x.
A developer implemented GPT-2 small and KV cache in PyTorch on a single A40. At context length 1000, FLOPs estimates drop ~1000x, but per-token latency only falls from 29.69 ms to 4.95 ms (about 6x). The author also reveals two pitfalls: incorrect cache permutation can pass single-token tests, and cuBLAS workspace and allocator block size pollute memory baselines.
An Engineering Truth Hidden Behind "Theoretical Gains"
KV Cache appears in nearly every article discussing LLM inference optimization, but most people just repeat "it avoids redundant computation." A developer on Reddit did something more valuable: they implemented GPT-2 small and KV cache in PyTorch by hand, aligning paper math with real inference measurements.
The experimental setup was restrained and rigorous—a single NVIDIA A40, fp32 with TF32 disabled, batch size 1, greedy decoding, CUDA synchronization on every timing, and the median of five runs per context length. After loading pretrained weights, they compared logits against the Hugging Face implementation and verified that cached and uncached greedy outputs matched exactly across 200+ tokens.
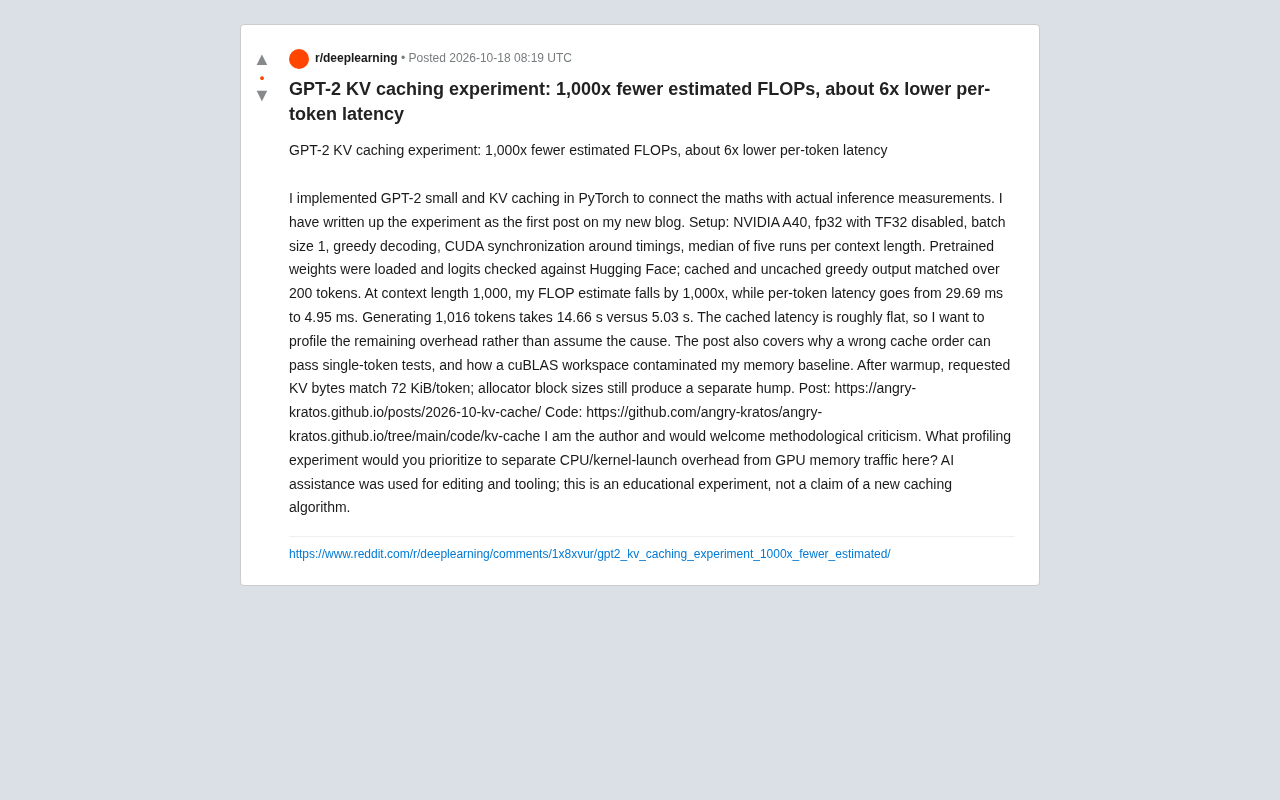
The results reveal a thought-provoking gap: at a context length of 1000, FLOPs estimates drop by roughly 1000x, while per-token latency only falls from 29.69 ms to 4.95 ms—about 6x. Total time to generate 1016 tokens drops from 14.66 s to 5.03 s. That enormous chasm between theory and measurement is where the real information from this experiment lies.
FLOPs Drop 1000x—Why Is Latency Only 6x?
The Shift in Arithmetic Intensity
Without caching, every generated token requires redoing attention computation over the full history context, with computation growing linearly with context length. With caching, the Key/Value of historical tokens is saved, and each step only processes the new token. So at long context, the FLOPs reduction is dramatic.
But latency is not equivalent to FLOPs. The author observed a key phenomenon: cached per-token latency is essentially flat, no longer growing significantly with context. This suggests the bottleneck is no longer matrix multiplication but something else—possibly CPU-side scheduling, kernel launch overhead, or GPU memory bandwidth.
Arithmetic intensity refers to the ratio of floating-point operations to memory access bytes required by a computational task, typically measured in FLOP/Byte. It determines whether a program is limited by compute or bandwidth on given hardware: when arithmetic intensity exceeds the hardware's "ridge point" (peak compute divided by peak bandwidth), the task is compute-bound; below the ridge point, it is memory-bandwidth-bound. KV cache degrades each step's matrix multiplication from "large matrix times large matrix" to "vector times matrix," drastically reducing operation count while still reading in all cached K/V, so arithmetic intensity drops sharply and the bottleneck shifts from SM compute units to HBM bandwidth and fixed overheads like kernel launches. This explains why FLOPs drop 1000x while latency only drops 6x—the latter is constrained by an entirely different resource curve.
Why the Author Refuses to Conclude
Commendably, the author explicitly states they want to "profile the remaining overhead rather than assume the cause." In the inference optimization field, this restraint is rare. Many blogs would directly attribute the 6x latency to "memory bandwidth limitation," but under single-batch, fp32, A40 conditions, the real cause requires data to speak. They openly ask at the end: to distinguish CPU/kernel launch overhead from GPU memory traffic, which profiling experiment should be prioritized?
To distinguish CPU scheduling/kernel launch overhead from GPU memory bandwidth, several common profiling approaches exist: NVIDIA Nsight Systems provides a timeline view that visually shows gaps between CPU-side dispatch and GPU execution, quantifying launch overhead and synchronization waits; Nsight Compute gives per-kernel throughput, achieved occupancy, DRAM read/write bytes, and "memory throughput as percentage of peak," directly determining whether bandwidth-bound. PyTorch's built-in torch.profiler can collect CPU/CUDA activity at low cost and export Chrome traces, suitable for initial screening. In practice, you typically use Nsight Systems first to see where time goes, then Nsight Compute for fine-grained analysis of hot kernels; if Python/scheduling overhead is suspected, you can also compare latency changes after CUDA Graph capture.
Two Implementation Details That Easily Go Wrong
Wrong Cache Order Can Still Pass Single-Token Tests
The author dedicated a section to explaining why incorrect cache permutation order can pass single-token tests. The reason is simple: when generating only one token, there is only one history entry in the cache, and any permutation degenerates to the same result. Only when sequences grow longer and multiple cache entries exist does position mismatch manifest as output deviation.
This is a reminder for anyone testing their own inference implementation: single-step validation almost never proves cache correctness. The author's approach was to compare cached and uncached versions token-by-token on greedy outputs across 200+ tokens—that is an effective regression test.
In autoregressive attention, positional information enters computation in two ways: explicit positional encoding (GPT-2 uses learnable position embeddings added to token embeddings), and attention's inherent dependence on sequence order. If the K/V permutation in the cache is misaligned with the positions assumed by query vectors, mismatch ("query at position t reading cache at position s") only appears when sequence length exceeds 1. Combined with causal masking requiring each position to see only itself and prior tokens, wrong order directly changes the visible set, thereby changing softmax weights and outputs. In single-token scenarios, cache length is 1, any permutation is equivalent, so such bugs are extremely insidious and must be exposed through long-sequence token-by-token comparison.
cuBLAS Workspace Pollutes Memory Baseline
The second detail is more engineering-oriented: cuBLAS workspace occupies GPU memory, polluting baseline memory measurements. After warmup, the author measured requested KV bytes matching 72 KiB/token, but allocator block size creates another "bump," making the memory curve appear larger than theoretical values.
This means that if you use only coarse-grained metrics like torch.cuda.memory_allocated() to verify KV cache memory gains, you can easily draw wrong conclusions. Distinguishing "requested bytes" from "actual allocated blocks" is necessary.
cuBLAS workspace is a GPU memory region reserved by cuBLAS for temporary results or internal algorithms when executing certain matrix multiplications, whose size is determined by the CUBLAS_WORKSPACE_CONFIG environment variable or the library's default policy, typically allocated on first call to relevant kernels. It is not a user tensor but counts toward the memory pool managed by PyTorch's caching allocator, so after warmup there appears an extra occupation that cannot be attributed to KV cache. Similarly, PyTorch's CUDA caching allocator requests memory from the driver in fixed-size blocks, so actual retained bytes often exceed requested bytes; memory_allocated() reflects allocated tensors, while memory_reserved() includes block-level fragmentation. To verify KV cache's theoretical memory gains, combine torch.cuda.memory_summary() with per-layer tensor size accounting rather than relying on a single coarse-grained metric.
The Real Value of This Experiment
From an engineering perspective, this project's contribution is not "discovering that KV cache is useful"—that is common knowledge. Its value lies in three points:
First, it provides a reproducible baseline with correctness verification. Code and article are public on the author's personal blog and GitHub repository (angry-kratos.github.io), so anyone can run the same numbers.
Second, it quantifies the gap between "theoretical speedup" and "end-to-end latency." 1000x versus 6x—this ratio itself refutes the intuition that "FLOPs determine everything." For those doing inference service capacity planning, this gap directly corresponds to cost model errors.
Third, it honestly marks its boundaries. The author explicitly states this is an educational experiment, does not claim to propose a new caching algorithm, and that AI was used only for editing and toolchain assistance.
If you are also building your own inference stack, the next steps are clear: first extend correctness testing from single tokens to long sequences, then use profilers to break down how much of that 4.95 ms goes to kernel launches versus memory transfers.
One-line Summary
Developer hand-implements GPT-2 KV cache; FLOPs drop 1000x while latency only drops 6x.
Paragraph Summary
A developer implemented GPT-2 small and KV cache in PyTorch on a single A40, ensuring correctness by comparing logits against Hugging Face and verifying token-by-token greedy outputs across 200+ tokens. Experiments show that at context length 1000, FLOPs estimates drop ~1000x, but per-token latency only falls from 29.69 ms to 4.95 ms (about 6x), with total time for 1016 tokens dropping from 14.66 s to 5.03 s. Cached per-token latency stays essentially flat as context grows, indicating the bottleneck has shifted from matrix multiplication to kernel launches or memory bandwidth. The author also reveals two pitfalls: incorrect cache permutation can pass single-token tests; cuBLAS workspace and allocator block size pollute memory baselines.
Related articles

Cursor AI Programming in Practice: Build a Student Management System from Scratch in 30 Minutes
A Bilibili creator demonstrates Cursor AI programming: generating a student management system in 30 minutes with natural language. Details on Agent mode, Claude selection, prompt techniques, and thresholds.

Top 20 AI Coding Tools Ranking: From Rock-Solid to Lackluster, a Scored Matrix
Bilibili creator releases top 20 AI coding tools ranking, tiered T0–T4 from rock-solid to lackluster, with Claude Code and Codex tied at T0. This article details the scoring dimensions (capability, reliability, robustness, durability, cost, domestic availability) and tool performances to help developers choose the right AI coding assistant.

Vibe Coding Systematic Tutorial: Master AI-Assisted Programming from Zero
A three-month Vibe Coding tutorial from a Bilibili creator covering Codex, ClaudeCode, and Cursor, from core logic to commercial project practice for beginners.