Graph Engineering: The AI Workflow Design Method That Goes Beyond Prompts

Graph Engineering designs AI workflows as directed graphs, replacing single chat prompts with planners, parallel researchers, skeptics, and human approval gates.
Graph Engineering structures complex AI tasks into directed workflows, distinct from prompt engineering (asking better questions) and context engineering (providing better information) — it's about designing the work itself around AI. Its core is a "diamond" pattern: a planner breaks down the problem, multiple researchers work in parallel, an independent skeptic challenges conclusions, a merger synthesizes the evidence, and a human approves the result. Implementation follows three levels: manual swim lanes, file-based paper trails, and orchestration tools like LangGraph or n8n — with tools introduced only after the workflow is understood. The deeper value is that each run accumulates reusable memory assets, making the workflow continuously smarter over time and building a durable competitive moat.
From Prompts to Workflows: A Rising New Concept
Recently, the term "Graph Engineering" has been popping up frequently on Twitter. A new buzzword emerges in the AI space every few weeks — prompt engineering, context engineering, agent engineering, vibe coding… Some are pure hype, others are genuinely useful. Startup podcast host Greg Eisenberg believes graph engineering falls into the latter category, because it offers a better lens for understanding "how AI actually gets work done."
The simplest way to distinguish three key concepts: Prompt Engineering is about asking AI better questions. Context Engineering is about giving AI better information. Graph Engineering is about designing the work itself around AI — so the entire task no longer gets crammed into one chaotic conversation window.
Here's an example. Most people researching a startup idea will open a chat window and ask directly, "Should I do this?" The model gives back an answer that sounds reasonably smart: market size, a few competitors, a go-to-market plan. You feel like you've done your research. But if you think about it, something feels off — a single model, in a single generation, decided what mattered, researched the market, interpreted the evidence, wrote the recommendation, and rated its own confidence. You might invest years based on that one block of text and end up going in the wrong direction.
What Is Graph Engineering: Breaking AI Tasks Into a Flowchart
At its core, graph engineering turns a messy AI task into a workflow you can actually trust. Using the startup research example, the "graph" version looks completely different:
- A Planner breaks the question into multiple angles
- One researcher looks at customers, one at competitors, one at distribution channels, one at pricing, one at risks
- A Skeptic tries to knock down the weak conclusions
- A Merger organizes the surviving evidence into a one-page recommendation
- Finally, you (the human) approve the decision before any action is taken
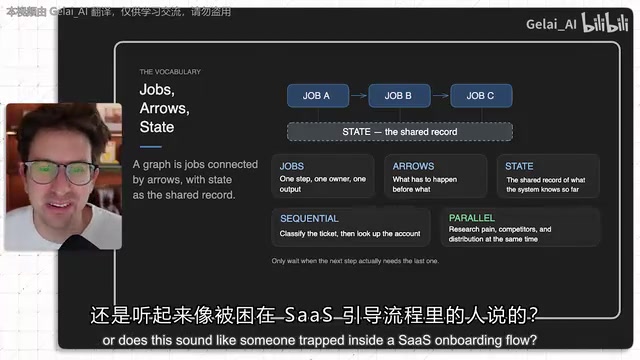
A few key terms here. A Node is each unit of work. An Edge is the handoff between units of work. State is the information the system currently holds. It sounds technical, but this is exactly how real work unfolds. Think about customer support: when a ticket comes in, you rarely just "answer the ticket" — you first categorize the issue, look up the customer's history, search relevant policies, draft a reply, then decide whether human review is needed. Connect these steps by their dependencies, and you have a graph.
The key insight is that most people use AI in a straight line — because the chat window makes everything feel sequential: first research, then summary, then draft, then revision. For simple tasks, this is fine. But when work has multiple parts, the linear conversation approach becomes slow, murky, and hard to trust. A graph lets you design work like you're managing a small team: one part plans, several parts work in parallel, one part checks, one part merges, and a human approves at the end.
Knowledge Graphs vs. Agent Graphs: Two Easily Confused Concepts
A lot of confusion comes from the fact that "graph" actually has two meanings in AI.
A Knowledge Graph helps AI understand relationships between things: this customer is at this company, this company uses this product, this product connects to that tool, this support issue relates to a certain feature, and that feature belongs to a certain team. Standard RAG often struggles to retrieve anything beyond passages that are textually similar to the question — but when an answer requires connecting across different people, companies, topics, and claims, it falls short. Microsoft's GraphRAG is a prime example of this category.
An Agent Graph is about how work flows: a planner hands off to researchers, researchers work in parallel, a skeptic checks conclusions, a synthesizer merges them, and a human approves the final answer.
The simplest way to remember the difference: knowledge graphs help AI understand how information connects, while agent graphs help AI understand how work flows. The best systems eventually use both — but for founders, creators, operators, and small teams, agent graphs are the version you can start using today.
Microsoft GraphRAG is a great case study for understanding the value of knowledge graphs. Traditional RAG (Retrieval-Augmented Generation) splits documents into chunks and retrieves the passages most similar to a query using vector similarity — essentially "find similar text." GraphRAG goes further by pre-extracting entities (people, companies, products, events) and their relationships from documents, organizing them into a graph structure. When a query comes in, the system doesn't just find directly relevant passages — it can "walk" along the graph's edges. For example: starting from a customer, find the company they belong to, then find the products that company uses, then find related support records. This kind of multi-hop reasoning significantly outperforms standard RAG on accuracy when handling complex research reports, enterprise knowledge bases, or legal documents. The tradeoff is an extra graph-construction step, plus the storage and query overhead of a graph database like Neo4j — so it's best suited for scenarios with complex information relationships that require cross-document reasoning, not every retrieval task.
When Should You Use Graph Engineering
The rule of thumb is simple: when work involves multiple steps, multiple sources, multiple paths, requires checking, carries risk, or needs approval — that's when graph thinking truly matters.
If you just want AI to generate 10 names for a new project, or summarize a short email, you don't need a graph. But if you're doing deep research, building a go-to-market plan, triaging support tickets, reviewing code, preparing for a sales call, synthesizing customer feedback, or producing recurring content — that's where graph engineering earns its keep.
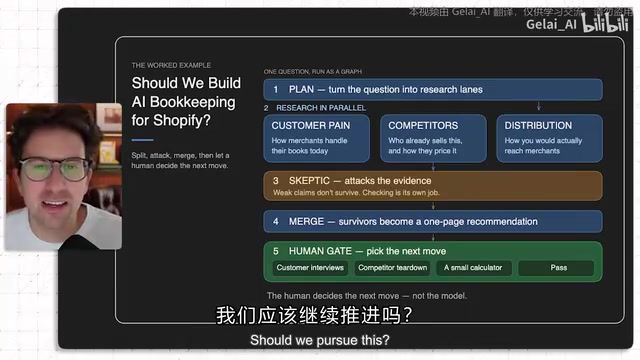
Three more specific criteria: the work has multiple steps; some steps can happen simultaneously; and the final output needs to be checked before it takes effect. This creates a "diamond" structure — start with one question, branch into multiple parallel paths, check the work, then converge back into one answer.
Take the question "Should I build an AI bookkeeping product for Shopify merchants?" as an example: the planner breaks it down into customer pain points, competitive landscape, entry points, pricing pressure, and risks. Then one researcher digs into Shopify merchants' bookkeeping pain points (do they use QuickBooks or spreadsheets? do they struggle at tax time?), another researches competitors, and a third looks at distribution channels — these three can run in parallel since they don't depend on each other. Then the skeptic asks: which claims actually have support? Which evidence is outdated? Which competitor got overlooked?
This step matters more than people think. A lot of AI research fails because the model writing the answer is also the one grading the answer — which is like letting someone write their own performance review, then being surprised when they describe themselves as "visionary." In a good graph, review is a separate job.
From Manual to Automated: Three Levels of Implementation
This is where people most often go overboard. You'll see people on Twitter jumping straight to LangGraph, AutoGen, or custom agent frameworks on day one. But the recommended starting point is far simpler.
Level 1 (Beginner): Run it manually. Give each job its own "swim lane": one lane for customer research, one for competitor research, one for distribution research, a review lane that attacks the evidence, a merge lane that produces the recommendation. That's basic graph engineering. It's slower than a fully automated system, but much easier to understand. Use a whiteboard tool like Excalidraw or tldraw, write your final goal at the top, and sketch out the roles and arrows. The first step is: draw the graph before you automate it.
Level 2 (Intermediate): Have each step write a file. Using Claude Code, Codex, or a code repository: the planner writes plan.md, researchers write customer.md, competitors.md, distribution.md, the skeptic writes review.md, and the merge step writes recommendation.md. This leaves a clear paper trail — you can compare versions and reuse the structure.
Level 3 (Advanced): Real orchestration tools. LangGraph is suited for scenarios that need state checkpointing, persistence, and human-in-the-loop approval. AutoGen GraphFlow is suited for directed workflows with ordered steps, parallelism, conditional branching, and loops. n8n and Make.com are ideal when your workflow needs to touch real business systems like Slack, email, Airtable, or a CRM.
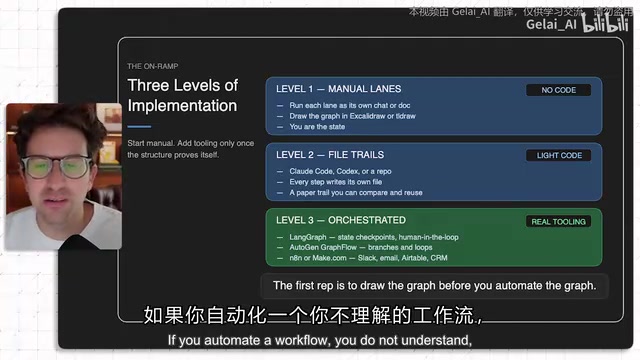
But the core point is: the tools aren't the point — tools should come after the workflow. If you automate a workflow you don't understand, you get a mess. If you understand the workflow first, automation becomes obvious. If the manual version doesn't produce clearly better results, automation will just produce mediocre results faster.
LangGraph, AutoGen, and n8n represent three different design philosophies — picking the wrong tool adds unnecessary complexity. LangGraph, built by the LangChain team, is a graph orchestration framework whose core strength is "stateful cyclic graphs" — nodes can loop, state can be persisted to a database, and it supports human-in-the-loop interruption points. It's ideal for agent systems that need conditional branching, backtracking, or long-term memory, though it has a steep learning curve. AutoGen is Microsoft Research's multi-agent conversation framework, suited for multiple agents collaborating via message passing. GraphFlow is its extension for structured workflows with clear sequencing and parallelism. n8n and Make.com are visual no-code/low-code workflow tools whose value lies in their connector ecosystems — hundreds of out-of-the-box integrations with Slack, Gmail, Notion, Salesforce, and more. For non-technical operations or content teams, these offer the lowest-friction path to automation.
Three Real-World Use Cases and One Common Mistake
Customer Support Graph: Classify the issue (billing / product confusion / bug / churn risk) → check account context (new customer? high-value? prior complaints?) → search docs or internal policies → draft a reply → reviewer checks for accuracy, tone, and risk → human approves any action involving refunds, account changes, angry customers, or legal risk.
Content Graph: Research → propose arguments → find case studies → write a hook → draft a script → reviewer asks whether the examples are specific, whether the pacing works, whether the writing sounds human → branch out into title, thumbnail, captions, B-roll.
Coding Graph: Make a plan → one agent edits code → another reviews the diff → another runs tests → another checks the UI in a browser → another hunts for edge cases → human approves the final PR. This is essentially the direction every AI coding tool is heading — the model that writes code is just one part of the workflow. The leverage is in planning, testing, reviewing, and judging what's safe to ship.
The mistake to watch out for: more agents ≠ better output. Sometimes more agents just means more noise — five AIs confidently repeating the same wrong idea, or a system spending more time coordinating than thinking. The goal isn't to build the biggest graph. It's to build the smallest graph that actually improves the quality of the work. A good graph should eliminate false waiting, separate workers from reviewers, preserve human approval where errors are costly, stop when the answer is good enough, and leave behind useful state.
The Compound Returns of Graph Engineering: Your Work Develops Memory
The most underrated value of graph engineering isn't just making individual tasks better — it's that your work starts to develop memory. Every customer research graph accumulates better customer notes. Every content graph accumulates better case studies and audience insights. Every support graph accumulates better product feedback. The graph produces both the work and the memory that makes the next graph smarter — and that's where context becomes a moat.
How to get started? Here's a clear path: pick one workflow you're already running with AI every week; write down the final output in one sentence; list every job a great human would do; draw arrows only where real dependencies exist; add a human checkpoint before any expensive decision; then run it manually once.
After running it once, the way you look at AI will change. You'll stop obsessing over "what's the perfect prompt" and start thinking "what's the perfect workflow." That's exactly why graph engineering is worth paying attention to — it's the logical next step after prompts. From AI user to "AI work manager," you're no longer just prompting AI — you're managing AI's work.
The "memory" mentioned here corresponds technically to long-term memory mechanisms in agent systems. Unlike short-term memory that disappears when a conversation window closes, long-term memory persists the key outputs of each run — customer insights, effective arguments, eliminated competitors — to a vector database or structured storage, where they can be retrieved and applied in future runs of similar tasks. This gives workflows a "learning effect": the 10th run of a customer research graph can automatically reference interview summaries and failed hypotheses accumulated over the previous 9 runs, avoiding repeated mistakes. From a product perspective, this is exactly the mechanism through which individuals or small teams can build a differentiated moat — given the same LLM, whoever's workflow has accumulated more high-quality domain memory will produce higher-quality outputs. And this advantage compounds over time in a way that's difficult to simply copy.
Related articles

LynnReal-Omni: 32B Unified Video Diffusion Model Goes Open Source with Multi-Task Coverage in Four Steps
LynnReal-Omni is a 32B unified video diffusion model on MiniMax H3, covering text-to-video, pose guidance, style transfer, restoration in 4 steps. Flash version generates 540p video in 377ms on one H100.

Anthropic Co-Founder: AI 'Kill Switch' May Need to Be Mandatory by Law
Anthropic's co-founder tells the BBC that AI 'kill switches' may need to be legally mandated. We analyze the industry logic, technical challenges, and the tension between regulation and innovation.

The AI Data Center Boom Is Colliding With Cities Scarred by Heavy Industry
The AI data center boom is clashing with post-industrial communities. Philadelphia's case reveals structural conflicts between AI growth, energy use, water, and environmental justice.