Kimi K3.1 Scores 55 to Reach the Pareto Frontier, Domestic Models Advance Further on Cost-Effectiveness

Kimi K3.1 reaches the Artificial Analysis cost-effectiveness frontier with a score of 55, becoming a new candidate for cost-sensitive scenarios.
According to Hacker News discussions, Kimi K3.1 scored 55 on the Artificial Analysis comprehensive benchmark and landed on the Pareto frontier. The Pareto frontier is not an absolute score leaderboard but a cost-effectiveness map plotting inference cost against composite quality and connecting models with the highest quality at the same price; models on the line mean no clearly better solution exists within their price range. A score of 55 falls in the upper-middle range, and combined with its frontier position, its pricing appears relatively restrained, suitable for cost-sensitive scenarios like RAG, batch processing, and customer service dialogue with high daily call volumes. The article also flags three blind spots: the frontier is a snapshot that shifts as competitors cut prices, the composite index masks sub-item differences, and small community discussion volume means insufficient reproduction samples—production model selection still requires A/B hands-on testing with business samples.
Quick Take: What It Means for Kimi K3.1 to Break Into the Pareto Frontier
According to discussions on Hacker News, Kimi K3.1 scored 55 on the Artificial Analysis comprehensive benchmark and successfully landed on the Pareto frontier of that leaderboard. The news gained 80 points of traction on HN with 8 comments in the discussion thread—not exactly explosive, but the term "Pareto line" is enough to make anyone focused on model selection take a second look.
Artificial Analysis is a commonly used third-party model evaluation aggregation platform in the industry. It places scores from multiple benchmark tests and inference costs on the same coordinate chart, tracing out a "cost-effectiveness frontier"—a model on this line means that within a given price range, no other model can clearly surpass it in overall capability. Kimi K3.1 scoring 55 and landing on this line sends a core signal: its overall performance-to-price match has entered the top tier.
It should be noted that the original source only provided a title and scoring data, without publishing specific sub-scores, the composition of test benchmarks, or the list of comparison models. Therefore, the following analysis is based more on the general logic of the Pareto frontier evaluation framework rather than assertions about Kimi K3.1's individual capabilities.
How to Read Artificial Analysis's Pareto Frontier
Not a Leaderboard, but a "Cost-Effectiveness Map"
Many people treat Artificial Analysis as just another benchmark leaderboard, but its core value actually lies in two-dimensional positioning: the horizontal axis is typically inference cost (price per million tokens), and the vertical axis is the composite quality index. After plotting all participating models on this chart, connecting those models that have "the highest quality at the same price" forms the Pareto frontier.
What makes this line special is that it measures whether there exists a better solution. A model can make it onto the line even if its absolute score isn't high, as long as it has no rival at its price point; conversely, no matter how high the absolute score, if there's a stronger competitor at the same price, it will be pushed below the frontier line.
The Mathematical Origin of the Pareto Frontier
The Pareto frontier derives from the concept of Pareto optimality in economics: among a set of resource allocation schemes, if there is no other scheme that can improve at least one dimension without worsening others, that scheme is in a Pareto optimal state. Mapped onto the two-dimensional plane of model evaluation, with cost on the horizontal axis and quality on the vertical axis, a model on the frontier line means there is no other model with higher quality at no higher cost. Therefore, this line is essentially a set of "non-dominated solutions," and models on the line cannot be simply ranked against each other—they each achieve optimal cost-effectiveness at different price points. This also explains why models with lower absolute scores can still make the line: the criterion for the frontier is relative advantage, not absolute level.
Positioning Judgment for a Score of 55
From the publicly available score distribution, 55 falls in the upper-middle range—not the score range of flagship models, but sufficient to cover most general-purpose task scenarios. Combined with its position on the Pareto line, it is reasonable to infer that Kimi K3.1's pricing strategy is relatively restrained: trading moderate cost for overall capability that doesn't hold you back—exactly what developers truly care about in cost-sensitive scenarios like batch calls and agent pipelines.
What the Composite Quality Index Is
Artificial Analysis's composite quality index is not the raw score of a single benchmark, but a single value synthesized from scores of multiple independent evaluations (such as MMLU, GPQA, HumanEval, mathematical reasoning, instruction following, etc.) after standardization and weighting. The advantage of this approach is that it facilitates cross-model comparison and two-dimensional plotting; the disadvantage is that the weighting design can amplify or compress the contribution of certain capabilities. Different versions of the index may adjust benchmark composition and weights, so scores are not strictly comparable over time. When readers see a score of 55, they should understand it as "the composite ranking under the platform's current evaluation framework" rather than an absolute measure of model capability.
Practical Impact on Developer Model Selection
More Options for Cost-Sensitive Tasks
Models on the Pareto frontier are naturally suitable as "default tier" candidates. For teams doing RAG retrieval Q&A, content batch processing, customer service dialogue, and other high-daily-call-volume tasks, model unit price multiplied by call volume is a hard cost. Kimi K3.1 entering the frontier line means there's one more testable option in the "good enough and cheap" tier.
The HN comment section is small (8 comments), which also indirectly indicates that this news has not yet triggered large-scale hands-on discussion—a reminder that making the leaderboard does not equal passing production environment validation. When selecting models, it's still recommended to run small-scale A/B tests with your own business samples, focusing on areas that benchmarks don't cover, such as long-context stability and tool-calling success rates.
Differences in Inference Cost Calculation
The "price per million tokens" on leaderboards is usually the vendor's published pricing, but real call costs are also affected by factors such as input/output token ratio, cache hit rate, bulk discounts, and engineering costs from inference latency. For example, output token unit prices are often significantly higher than input tokens, and in agent pipelines the output proportion may be much higher than in ordinary Q&A. Therefore, after using the Pareto frontier for initial screening, teams should estimate actual bills based on their own request input/output structure rather than directly applying leaderboard unit prices. This is also why leaderboard positioning can only serve as an entry point to the candidate pool and cannot replace business-side cost estimation.
The Cost-Effectiveness Narrative for Domestic Models Continues to Hold
Putting this news in a broader context, domestic models have continued to move up in third-party evaluations over the past two years, with a highly consistent approach: rather than pursuing head-on confrontation with the most expensive flagship models on absolute scores, they make the cost-effectiveness frontier their main battlefield. Kimi K3.1 landing on the Pareto line is another implementation of this strategy.
Limitations of Third-Party Evaluation Aggregation Platforms
Data sources for aggregation platforms like Artificial Analysis are mostly public benchmarks and vendor self-reports. Evaluation environments, prompt templates, and sampling parameters may not match real business scenarios, and some benchmarks carry data contamination risks (overlap between training and test sets). In addition, version updates for closed-source models are often opaque, and leaderboard snapshots may correspond to older version weights. Therefore, "landing on the Pareto frontier" is better suited as a screening signal rather than a conclusion: it can efficiently narrow the candidate range, but the final reliability judgment still needs to be verified on private data for the target task.
A Rational Perspective: Three Blind Spots Beyond Benchmark Scores
First, the Pareto frontier is a snapshot, not a promise. Competitor price cuts or new model releases can cause a model to slide off the line, so selection decisions should not treat leaderboard position as a long-term contract.
Second, the composite index masks task differences. A score of 55 is a weighted result across multiple benchmarks; performance on code, math, long-text understanding, and other sub-items may vary considerably, so specific tasks require checking sub-item data.
Third, small community discussion volume means few reproduction samples. The 80 points and 8 comments on HN indicate that attention exists but validation is insufficient. Before production deployment, there should be an independent hands-on testing phase rather than directly trusting leaderboard conclusions.
Conclusion
Kimi K3.1 reaching the Pareto frontier of Artificial Analysis with a score of 55 provides the most direct value by offering cost-sensitive developers a new cost-effectiveness candidate. Its significance lies not in setting a new high score, but in reminding the market that the main line of model competition has partially shifted from "who is smartest" to "who is most cost-effective while being good enough." For teams currently selecting models, adding it to the candidate pool and running a round of business sample tests is a more pragmatic approach than just looking at leaderboards.
One-line Summary
Kimi K3.1 reaches the Artificial Analysis cost-effectiveness frontier with a score of 55, becoming a new candidate for cost-sensitive scenarios.
Paragraph Summary
According to Hacker News discussions, Kimi K3.1 scored 55 on the Artificial Analysis comprehensive benchmark and landed on the Pareto frontier of that leaderboard. The Pareto frontier is not an absolute score leaderboard, but a cost-effectiveness map that places inference cost and composite quality on the same two-dimensional plane and connects models with "the highest quality at the same price"; models on the line mean there is no clearly better solution within their price range. A score of 55 falls in the upper-middle range, and combined with its frontier position, it can be inferred that its pricing is relatively restrained, suitable for cost-sensitive scenarios with high daily call volumes such as RAG, batch processing, and customer service dialogue. The article also flags three blind spots: the frontier is a snapshot that shifts as competitors cut prices, the composite index masks sub-item differences, and small community discussion volume means insufficient reproduction samples—production model selection still requires A/B hands-on testing with business samples.
Related articles

M&M's Spent Millions Replacing Artificial Blue Dye — Why Is It So Hard?
Mars spent millions trying to replace artificial blue dye in M&M's with spirulina, but thick material clogs pipes and residue risks mold, forcing a full production-line rebuild. Here's the engineering behind the reformulation.
Teammate Wanted for Meta Global AI Developer Hackathon: Computer Vision & Medical AI
A Reddit developer seeks teammates for the Meta Global AI Developer Hackathon, focusing on computer vision and medical AI. This article analyzes the track logic, skills-complementarity needs, and topic selection strategy behind this teaming signal.
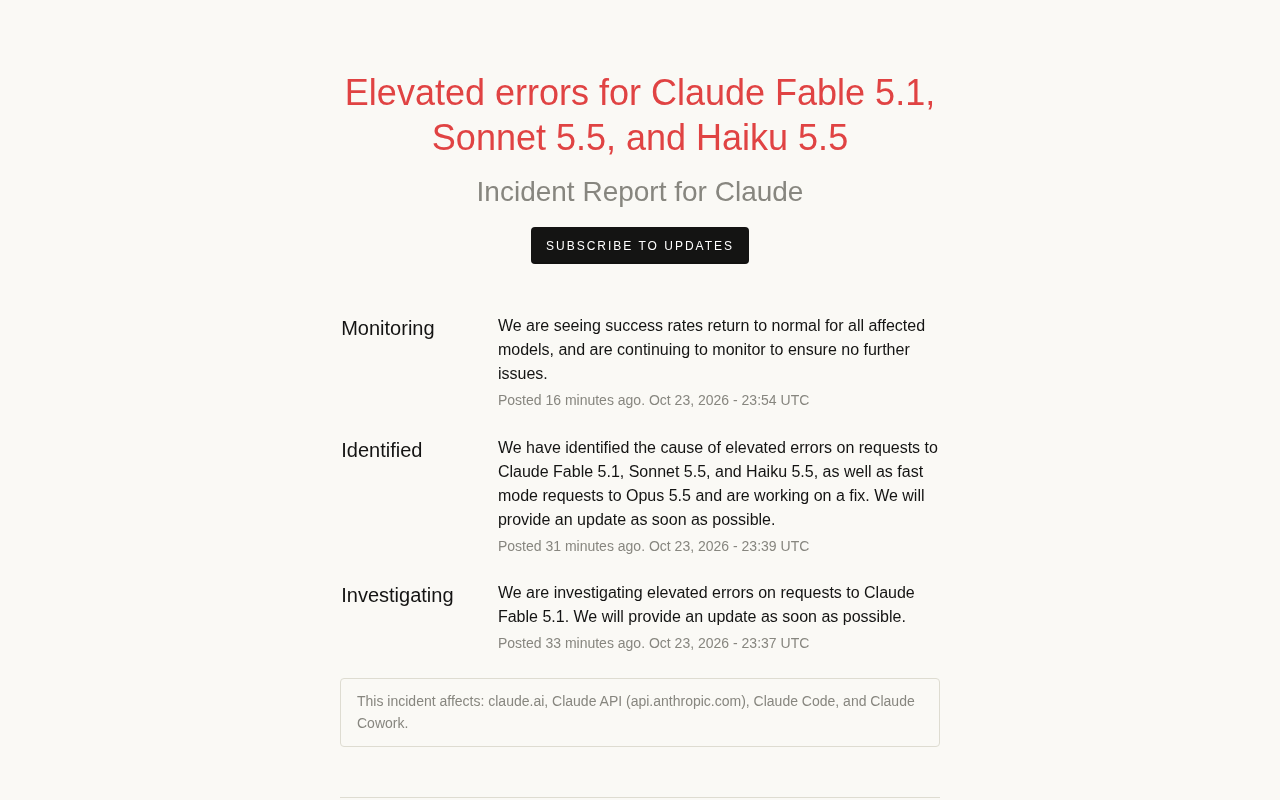
Multiple Claude Models Hit by Errors: A Postmortem of Fable 5.1, Sonnet 5.5, and Haiku 5.5
Claude Fable 5.1, Sonnet 5.5, Haiku 5.5, and Opus 5.5 fast mode saw elevated errors; Anthropic identified and resolved the issue in 17 minutes. This postmortem covers the timeline, the technical reasons for the multi-model cascading failure, and practical lessons for retry and degradation strategies.