Multiple Claude Models Hit by Errors: A Postmortem of Fable 5.1, Sonnet 5.5, and Haiku 5.5
Multiple Claude models saw elevated error rates within 17 minutes before recovery, exposing the cascading risks of shared infrastructure.
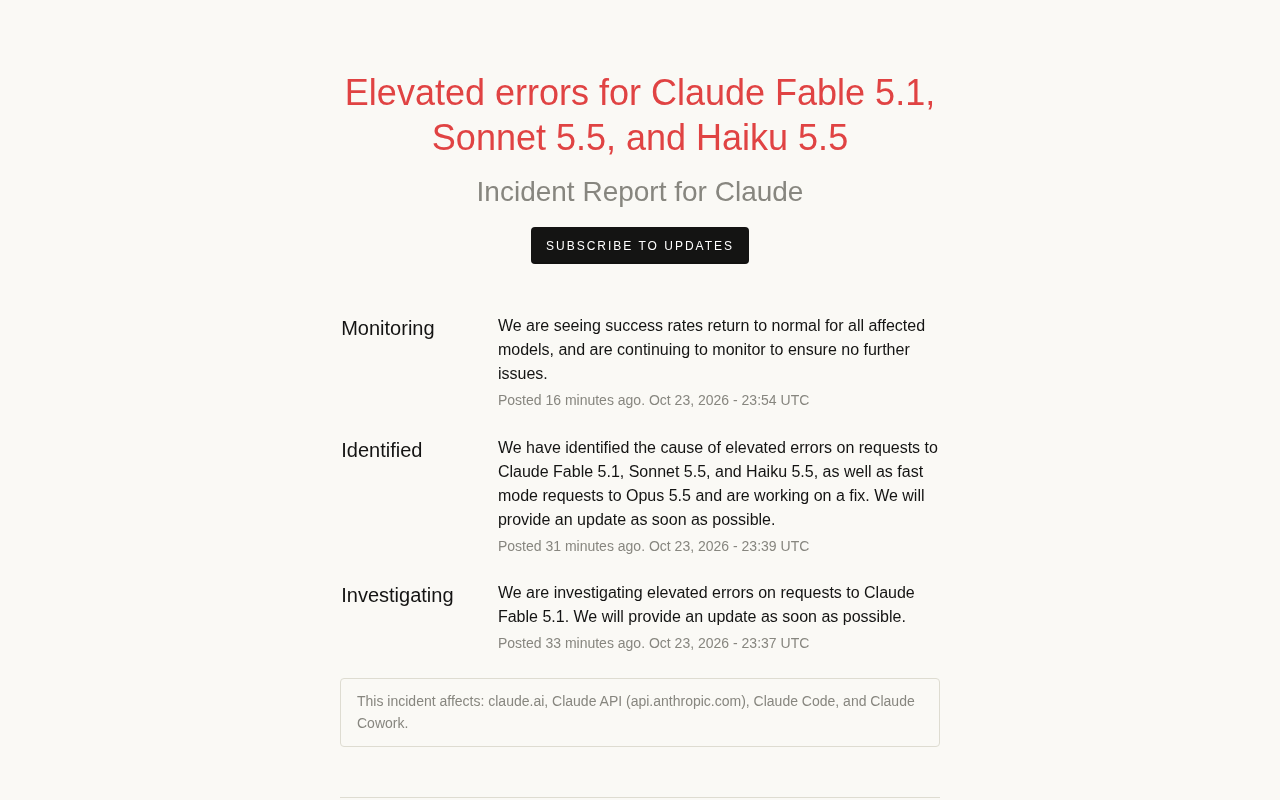
Based on Anthropic's status page RSS, this article outlines a roughly 17-minute outage: at 23:37 UTC, elevated error rates were first reported for Claude Fable 5.1; at 23:39, the impact expanded to Sonnet 5.5, Haiku 5.5, and Opus 5.5 fast mode; at 23:54, recovery was announced and monitoring began. The official wording was "elevated errors" rather than "outage," meaning requests could still return but with a higher failure rate—a more insidious problem. The author analyzes that the rapid spread from a single model to multiple models in the same generation suggests the fault source was more likely in shared layers such as inference infrastructure, routing/scheduling, or authentication/rate limiting, rather than a single model deployment; that only Opus 5.5 fast mode was affected indicates that low-latency paths are a separate failure domain. For developers, the key takeaways are: status page subscriptions should be integrated into internal alerting chains; model degradation should not rely solely on same-generation models but should retain cross-provider paths; and retry versus degradation strategies should be differentiated based on error codes.
An Outage That Lasted Less Than 20 Minutes
According to the official status page RSS feed, Anthropic began investigating an elevated error rate for Claude Fable 5.1 at 23:37 UTC. Two minutes later, the scope was expanded to Sonnet 5.5, Haiku 5.5, and fast mode requests for Opus 5.5. At 23:39, the company stated it had identified the root cause and was working on a fix, and at 23:54 it announced that success rates for the affected models had returned to normal levels while continuing to monitor. From the first notification to recovery, the whole process took about 17 minutes.
The status update itself doesn't contain much information, but the pace of the notifications and the scope of impact are worth examining: why would a problem with one model spread to other models in the same generation within two minutes?
Incident Timeline and Scope of Impact
Here's a breakdown of the three status page updates:
- 23:37 Investigating: Only mentioned an elevated error rate for Claude Fable 5.1, cause not yet confirmed.
- 23:39 Identified: Impact expanded to Sonnet 5.5, Haiku 5.5, and fast mode for Opus 5.5; the company said it had found the cause.
- 23:54 Monitoring: Success rates for all affected models returned to normal, entering the monitoring phase.
You may not have noticed, but the official notice used "elevated errors" rather than "outage." These two terms have a clear distinction in status page contexts: the former means requests can still return, just with a higher failure rate than baseline; the latter usually means complete unavailability. For applications relying on APIs, the former is more insidious—retry logic may mask the problem, but users will perceive latency and occasional failures.
Additionally, only fast mode for Opus 5.5 was affected; standard mode was not listed. This detail suggests the issue wasn't a problem with an individual model deployment, but more likely related to a shared inference path or scheduling layer.
The Difference Between Elevated Errors and Outage
In the common semantics of cloud service status pages, elevated errors means the service as a whole is still running, but the proportion of failed responses for specific endpoints or models is significantly higher than the daily baseline, typically corresponding to some requests returning 5xx or timing out; outage means the service is completely unavailable or largely unreachable. Most vendors' status levels (such as Investigating / Identified / Monitoring / Resolved) are used in conjunction with this terminology: Investigating means an anomaly has been received but not yet characterized, Identified means the root cause or faulty component has been confirmed, and Monitoring means the fix has been deployed and metrics are being observed for stability. For callers, the insidiousness of elevated errors lies in the fact that the success rate may still be 80-90%, and monitoring dashboards may not trigger red alerts, but tail latency and retry volume will rise simultaneously—the actual degradation in user experience is often greater than the error rate numbers themselves.
Why One Model's Errors Drag Down a Whole String of Models
The company didn't disclose the technical root cause, but the sequence of notifications offers an angle for observation: the Investigating phase only named Fable 5.1, and it took two minutes to include Sonnet 5.5 and Haiku 5.5. This follows a typical process of "first detect the anomaly, then investigate the blast radius"—the initial alert came from monitoring metrics for a single model, and then engineers confirmed that the same fault source affected more models.
For multi-model product lines, this kind of cascading effect is almost structural. Models in the same generation often share inference infrastructure, routing layers, authentication, and rate-limiting components, and low-latency paths like fast mode may also reuse specific batching or caching strategies. When any layer has a problem, the symptom is "multiple models erroring simultaneously" rather than a single point of failure.
From an operations perspective, this also explains why status page notifications escalate from "single model" to "multiple models" so quickly: it's not that the error is spreading, but that the investigation scope is converging.
Typical Layers of Shared Infrastructure for Multiple Models
Models in the same generation often reuse the same technology stack, with typical layers including: the access layer (API gateway, authentication, quotas, and rate limiting), the routing and scheduling layer (distributing requests to inference clusters by model, region, and load), the inference runtime (batch scheduling, KV Cache management, memory allocation), and observability components (metrics collection, logging pipelines). When any shared component in any of these layers degrades—for example, a rate-limiting configuration error, an abnormal routing table, batch queue backlog, or cache breakdown—all models passing through that component will simultaneously show elevated error rates, regardless of the model's own weights or capabilities. Low-latency channels like fast mode typically have separate scheduling policies (more aggressive batching windows, shorter queue timeouts, dedicated caches), so they may become a different failure domain from standard mode—which is a reasonable explanation for why only Opus 5.5 fast mode was affected this time.
Practical Impact on Developers
A 17-minute outage window is a short-term blip for most applications, but the degree of impact depends on architecture design:
- Applications without retry logic will throw errors directly to end users, manifesting as interrupted conversations or failed tasks.
- Applications with exponential backoff retries may only experience increased latency, which users perceive as "slowness."
- Pipelines hardcoded to a single model have no fallback during an outage, while systems configured with model degradation (e.g., switching from Sonnet to Haiku, or switching to another provider) can minimize impact.
This outage also exposed an often-overlooked point: fast mode is a separate failure domain from standard mode. Products relying on low-latency paths for real-time interaction need to prepare degradation plans specifically for fast mode, rather than assuming that "Opus is available means everything is fine."
Exponential Backoff and Model Degradation
Exponential backoff means retry intervals grow exponentially (e.g., 1s, 2s, 4s, 8s), usually combined with random jitter to prevent a large number of clients from retrying simultaneously and causing a second avalanche. It's suitable for transient errors, but has limited effectiveness against rate-limiting (429) errors and may actually prolong request occupancy time. Model degradation, on the other hand, involves predefining a chain of decreasing capability (e.g., Sonnet → Haiku → other providers), automatically switching when the primary model's error rate exceeds a threshold or latency exceeds limits, and recording degradation events in observability metrics. A common engineering combination is: limited exponential backoff retries for 5xx and timeouts, direct degradation for 429 and persistent elevated errors, and maintaining a separate degradation path for fast mode to avoid sharing the same circuit breaker logic with standard mode.
What We Can Learn from This Incident
Status page subscriptions should be part of the alerting chain. This notification was published entirely through the status page RSS, with no proactive notifications through other channels. Integrating RSS or the status page API into internal alerting systems is much faster than waiting for user complaints before investigating.
Don't rely on just one backup for model degradation. The outage affected three primary models simultaneously, showing that the strategy of "if the primary model goes down, fall back to a downstream model" may fail among models of the same generation. Cross-provider or cross-generation degradation paths are more robust.
Distinguish between "errors" and "unavailability." In elevated errors scenarios, blind retries may exacerbate rate-limiting pressure. A reasonable approach is to combine error codes to determine retry strategy: limited backoff for 5xx errors, direct degradation for rate-limiting errors.
Pay attention to the wording of official notifications. The three phases—Investigating, Identified, Monitoring—correspond to different response actions: entering Monitoring means the primary fault has been resolved, but aftereffects (such as queue backlog, cache cold starts) may still persist, and it's not advisable to immediately restore full traffic at this point.
Summary
This was a typical short-term regional outage: starting with an abnormal error rate for a single model, affecting multiple models in the same generation and the fast mode path, with identification and recovery completed within 17 minutes. The company didn't disclose the root cause, but based on the notification pace, the problem was more likely at the shared infrastructure layer than with an individual model. For developers, the real value isn't the outage itself, but the reminder it provides: multi-model redundancy is not the same as multi-provider redundancy, and status page subscriptions and tiered degradation strategies should become standard features for API dependencies.
Related articles

Kyutai Releases CADRE: An Interactive World Model Video Autoencoder with Latency Cut to 230ms
Kyutai releases CADRE, an open family of 7 causal diffusion video autoencoders. CADRE-based world models run at 20 fps on a single H100 with under 230 ms reaction latency, offering a low-latency, reproducible open frontend for interactive world models.
Claude Opus 5.5 Error Spike: Officially Resolved, an 11-Minute Incident Retrospective
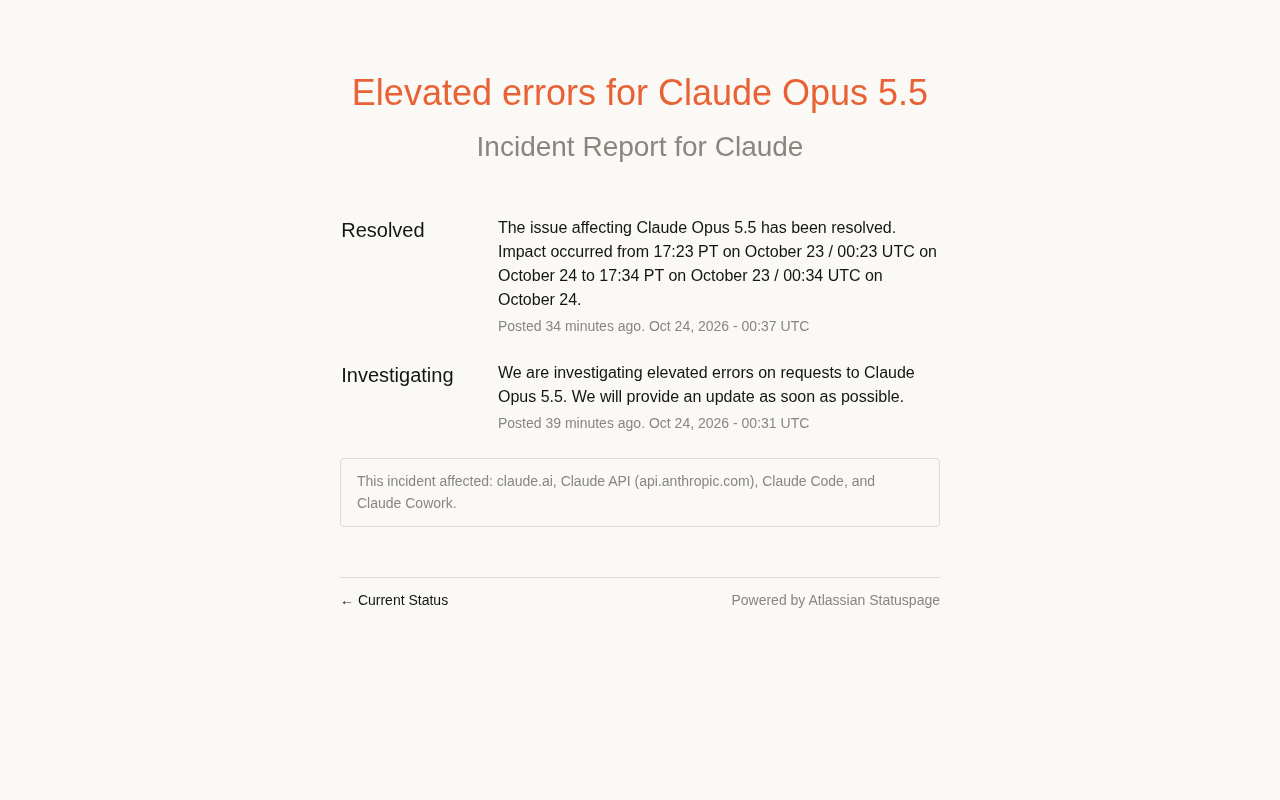
Claude Opus 5.5 experienced elevated request error rates; the official status page shows the incident lasted about 11 minutes before being resolved. This article covers the event timeline, scope of impact, and offers developers retry, fallback, and multi-model redundancy recommendations for handling short model outages.

M&M's Spent Millions Replacing Artificial Blue Dye — Why Is It So Hard?
Mars spent millions trying to replace artificial blue dye in M&M's with spirulina, but thick material clogs pipes and residue risks mold, forcing a full production-line rebuild. Here's the engineering behind the reformulation.