Lakebase Postgres Tuning: Raising shared_buffers to 75% of DRAM Doubles Throughput

Lakebase raises shared_buffers to 75% of DRAM on large Postgres instances, doubling production throughput.
Lakebase recently applied a cache strategy change to fixed-size Postgres instances with CU≥80: setting shared_buffers to 75% of DRAM and disabling the local file cache. By eliminating the double-buffering problem between shared buffers and the file cache, hot pages are kept exclusively in low-latency DRAM. Production results show up to 2× throughput gains, fewer storage reads, and lower latency. The strategy applies only to large, memory-rich instances where the working set can largely fit in DRAM — a useful reminder that conservative shared_buffers defaults deserve reconsideration in today's high-memory environments.
A Cache Strategy Shift That Delivers a Performance Leap
One of the core challenges in database performance optimization is keeping hot data on the fastest available access path. When more of Postgres's working set lives in DRAM instead of falling through to slower cache layers or storage, the system's overall response characteristics change dramatically.
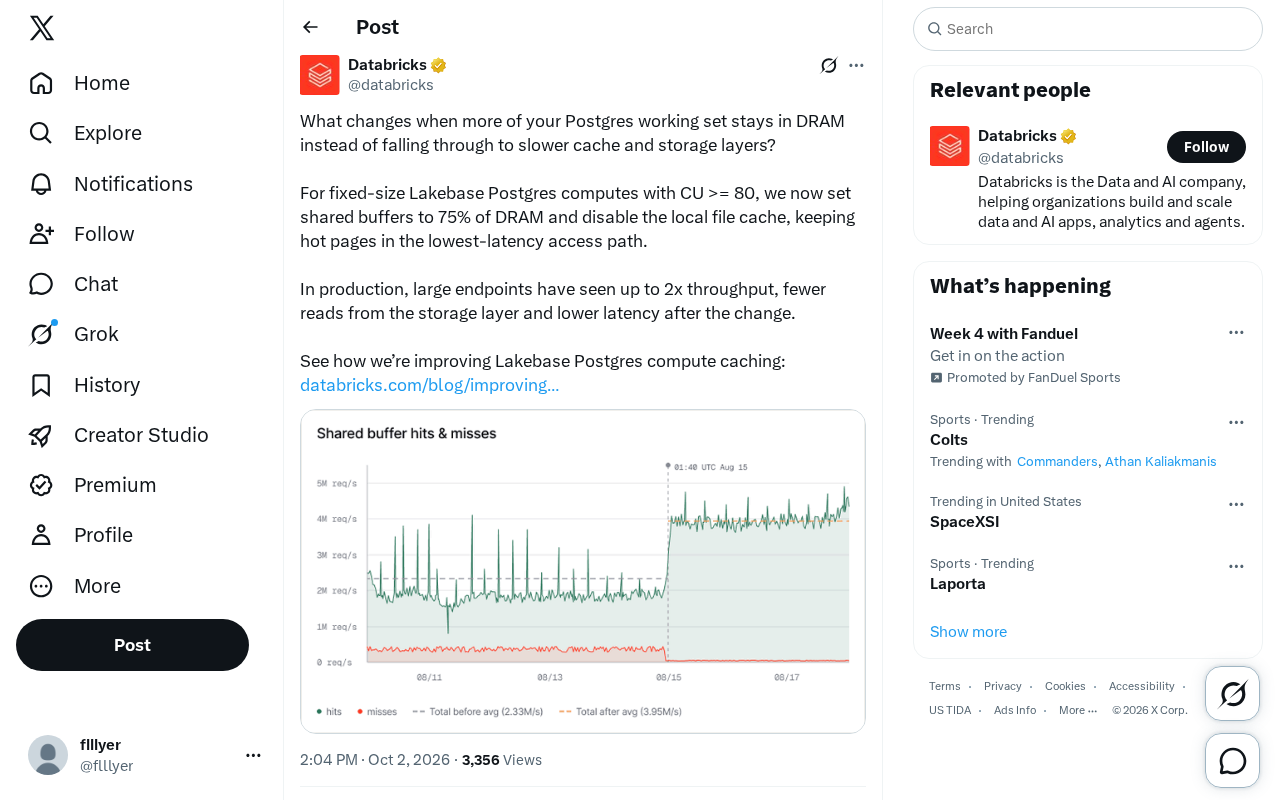
The Lakebase team recently announced a cache tuning change targeting Postgres compute resources: for fixed-size instances with CU (Compute Unit) ≥ 80, shared_buffers is now set to 75% of total DRAM, while local file caching is disabled — keeping hot pages on the lowest-latency access path available.
Why 75% and Why Disable the File Cache
Postgres memory access follows a clear hierarchy: from DRAM-backed shared buffers, to the OS page cache, and finally to the underlying storage layer — with latency increasing at each step. In traditional configurations, shared_buffers is set conservatively (the classic recommendation hovers around 25%), leaving a large portion of memory for the OS page cache to manage.
Lakebase takes the opposite approach: on large instances, shared_buffers is pushed all the way to 75%, and the local file cache is disabled. The reasoning is straightforward — on memory-rich compute nodes, allowing data to occupy both shared buffers and the file cache simultaneously creates a double-buffering problem, wasting memory and adding unnecessary copy overhead. It's more efficient to let Postgres's own buffer pool directly control a larger share of hot data and eliminate the middleman.
Eliminating the Double Buffering Problem
When both shared buffers and the OS page cache hold copies of the same data pages, memory is consumed redundantly and effective cache capacity is diluted. By disabling the local file cache, nearly all available memory is handed over to Postgres's buffer pool for unified management. Hot page hit rates improve, and the frequency of reads falling through to the storage layer decreases accordingly.
shared_buffers is one of Postgres's most important memory parameters — it directly determines how many data pages the database process can cache itself. The official Postgres documentation has long recommended setting it to around 25% of system memory, a conservative default rooted in the early days when servers had limited RAM and Postgres needed to share memory with other processes on the same machine, leaving room for the OS page cache to serve as a low-cost secondary cache.
However, the OS page cache is opaque and uncontrollable from Postgres's perspective — Postgres cannot precisely know which pages the OS has cached or when they'll be evicted. Cache decision-making is split across two independent subsystems. As cloud-native database nodes routinely ship with hundreds of gigabytes of RAM, the 25% ceiling often means leaving vast amounts of memory to OS management when the actual business working set could fit entirely within Postgres's own buffer pool. In this context, sticking to the conservative ratio becomes a waste of resources.
The double buffering problem is well-known in the Postgres ecosystem. When a data page is read from storage, it first enters physical memory through the OS kernel's page cache, and is then copied into shared buffers when the Postgres process reads it — the same data occupies two places in memory simultaneously. For sequential scans, Postgres actively hints the kernel to drop page cache entries via fadvise(POSIX_FADV_DONTNEED), but this automatic cleanup doesn't work well for random-read workloads, where double occupancy persists. The "local file cache" used by Lakebase is a local SSD/memory cache layer in its cloud-native storage architecture, sitting between shared buffers and remote object storage — it's not the standard Postgres OS page cache, but coexisting with shared buffers causes similar redundant caching issues. Once this layer is disabled, shared buffers become the sole residence for hot pages, cache decision-making is centralized, and effective capacity is maximized.
Real-World Production Results
According to data published by Lakebase, large endpoints showed significant improvements after the change was applied in production:
- Throughput increased by up to 2×
- Fewer reads hitting the storage layer
- Lower overall latency
These three metrics are mutually reinforcing — more read requests hit DRAM without falling through to storage, reducing I/O pressure, shortening response times, and naturally boosting throughput. For read-heavy workloads where the working set can largely fit in memory, the gains are especially pronounced.
Where This Applies — and Where It Doesn't
This optimization is not universally effective. Its applicability comes with important conditions:
Limited to fixed-size instances with CU ≥ 80. Only on nodes with sufficient memory does allocating 75% of DRAM to shared buffers make sense without starving other processes. Smaller instances that adopt this configuration blindly may become unstable due to memory pressure.
Requires a working set that fits in memory. The benefits depend on hot data largely fitting in DRAM. If the working set significantly exceeds available memory, hot pages will still be frequently evicted, and the gains will be limited.
Trade-offs of disabling the file cache. Turning off OS-level caching eliminates the waste of double buffering, but it also means that any miss in shared buffers goes directly to the storage layer — there's no intermediate buffer to catch it. This places a high demand on shared buffer hit rates; otherwise, cache misses become more costly.
CU (Compute Unit) is the abstract unit used by Lakebase and most cloud database platforms to quantify compute resources, typically representing a fixed ratio of vCPU to memory. CU ≥ 80 corresponds to large instances with memory in the hundreds of gigabytes range in Lakebase's tiering system. This threshold exists because, on smaller instances, allocating 75% of memory to shared buffers severely compresses the OS's available memory, impairing network stacks, file descriptor management, background processes, and other system-level operations — and potentially triggering OOM (Out-Of-Memory) kills. The working set refers to the collection of data pages frequently accessed within a given time window; its size directly caps the achievable cache hit rate. If the working set exceeds shared buffer capacity, even a large buffer pool cannot prevent frequent page evictions, and the marginal benefit of increasing the shared buffers ratio drops sharply.
Implications for Database Operations
This tuning case is also instructive for teams running self-hosted or self-managed Postgres. As cloud compute nodes ship with ever-larger memory footprints, the old rule of thumb — keep shared buffers conservative and rely on OS page cache — may no longer be optimal for large-memory deployments.
The core insight can be summarized as: when memory is abundant, reducing cache layers and letting the database control more of its hot data directly is often more efficient than relying on multiple caching tiers. That said, any configuration change should be validated through load testing against your own workload characteristics. Lakebase's 2× throughput gain reflects results under their specific workload and should not be treated as a universal expectation.
For managed service users, platform-applied optimizations like this deliver performance improvements without requiring manual tuning — one of the tangible advantages of managed databases over self-hosted deployments.
Related articles

macOS Is No Longer UNIX: Apple Didn't Renew Certification, But the Technology Is Unchanged
Apple did not renew macOS's UNIX certification, and the Open Group has removed Apple's entry. This article analyzes the technical reality behind the expiration, Apple's possible intentions, and the practical impact on developers.

Building Stateful Multi-Agent Systems with Azure Cosmos DB
Based on the official Azure Cosmos DB tutorial, this article explains how to use the Agent Memory Toolkit to add shared persistent memory to a multi-agent travel planner, covering short-term, long-term, episodic, and semantic memory plus cross-session state continuity.

Production AI Agent Operations: A Three-Step Framework for Observing, Evaluating, and Optimizing
Azure Cosmos DB team proposes a three-step framework for production AI Agent operations: observe trace tracking, evaluate with LLM as a judge and regression testing, optimize cost across RU, retrieval, memory, and LLM layers.