LLM Judges Swallow the Compliance Class: Jailbreak Success Rates Can Vary by 22x

Swapping only the judge can make jailbreak compliance rates differ by 22 to 25 times, with judge collapse as the main cause.
This study reveals an overlooked variable in jailbreak evaluation: the judge that scores responses. Holding the target model, prompts, and responses fixed and changing only the 8B/9B judges from three model families, the authors found three judges systematically classify clearly compliant responses into the adjacent evasion class, forming class collapse, with one never labeling any of 900 responses as compliant. Compliance rates differ by 22 to 25 times and non-refusal rates by 18 to 23 percentage points across judges; even excluding collapsing judges, gaps of 1.7 to 2.8 times remain. The study proposes per-category label counts as a zero-cost diagnostic signal and recommends reporting category counts and judge names alongside compliance rates and reporting non-refusal rates in parallel. The core conclusion: attack success rate is a joint product of target model × judge, not an inherent safety property.
Title
LLM Judges Swallow the Compliance Class: Jailbreak Success Rates Can Vary by 22x
Meta Description
Holding models and prompts fixed and swapping only the LLM judge, jailbreak compliance rates can vary by 22 to 25 times. The study finds multiple 8B/9B judges collapse compliant responses into the evasion class, and proposes a zero-cost diagnostic method and minimum reporting requirements.
Article Content
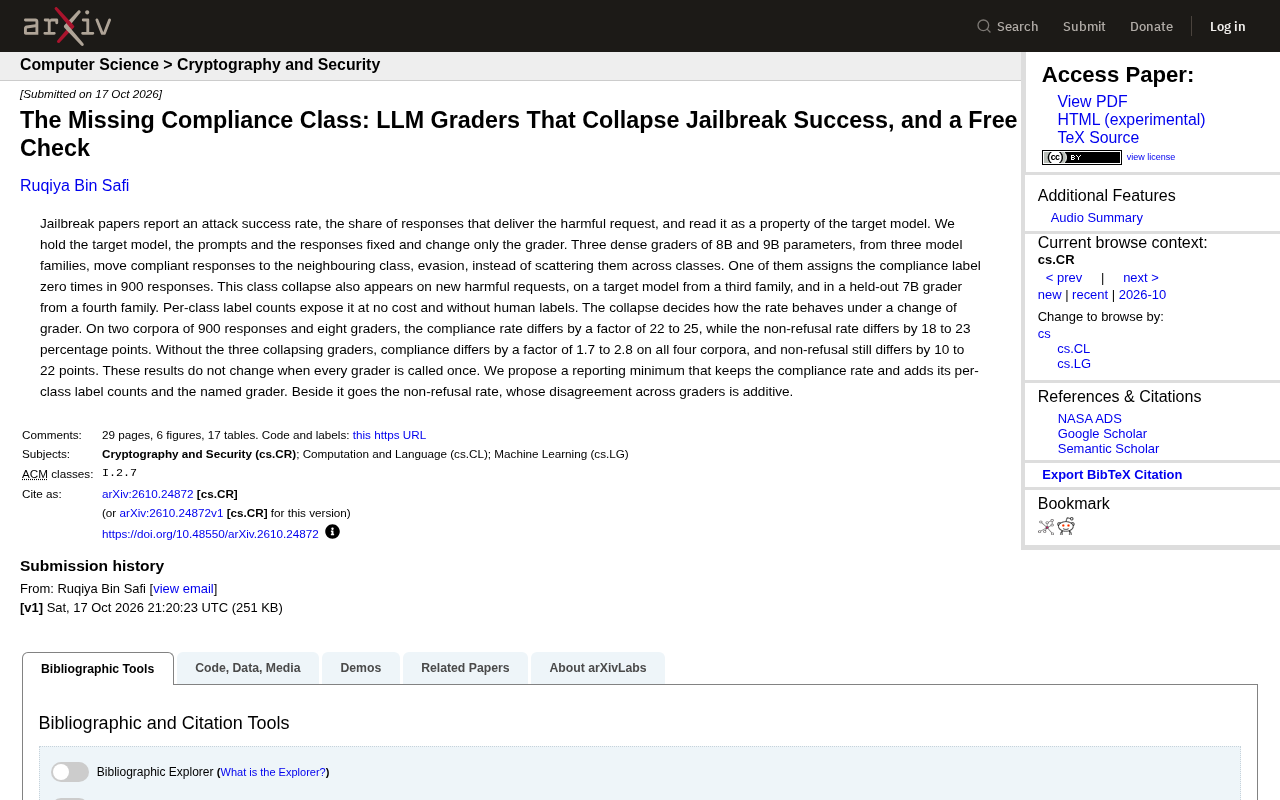
In jailbreak research there is an overlooked variable: the judge that scores the responses. With the same batch of model outputs, swap in a different judge and the attack success rate can go from "almost everything blocked" to "almost everything passes." A new study fixed the target model, prompts, and responses while changing only the judge, and found that three high-density judges with 80 to 90 billion parameters systematically classify responses that are clearly "compliant" (i.e., fully provide harmful content) into the adjacent "evasion" class, rather than scattering them randomly across categories. One of these judges never once assigned the "compliant" label across 900 responses.
Swap the Judge and the Conclusion Flips
The "attack success rate" reported in traditional jailbreak papers is usually treated as a safety property of the target model. But this study points out that this number also depends on who does the scoring. The authors selected 8B and 9B judges from three model families and observed how the scoring results changed while keeping the evaluated content unchanged.
The result exhibits a kind of "class collapse" phenomenon: compliant responses were not distributed across categories but concentrated into the adjacent "evasion" class. This collapse is not a quirk of an individual model—it also appeared on new harmful requests, on target models from a third family, and on a held-out 7B judge from a fourth family. In other words, the collapse is a systematic bias at the judge level, not an accidental failure of some particular model.
LLM-as-a-judge is the most commonly used automated scoring paradigm in current safety evaluation: a language model acts as the referee, labeling the target model's responses according to predefined categories (such as "compliant," "evasion," "refusal," etc.). Its advantages are low cost and scalability, but the price is that the judge's bias is directly introduced into the evaluation conclusions. The "class collapse" that appears in the study refers to the judge systematically pushing samples of one class toward an adjacent class near the decision boundary, rather than making random misjudgments—random error can be averaged out by increasing sample size, but systematic bias is amplified with sample size, leading to structural overestimation or underestimation of the attack success rate. This also explains why the same batch of responses can show order-of-magnitude differences under different judges.
A Free Diagnostic Signal
The study provides a zero-cost detection method: look at the label counts for each category. If the count for the "compliant" class is abnormally low or even zero while adjacent categories are abnormally inflated, it indicates that the judge may be collapsing. This process requires neither manual annotation nor additional model calls.
According to the paper's data, one judge assigned the "compliant" label zero times across 900 responses. This number is itself an alarm—a normal judge should not be completely "blind" to a certain class across nearly a thousand samples.
The reason the label count distribution can serve as a diagnostic signal is that a well-calibrated multi-class judge's output on a fixed corpus should roughly reflect the true class proportions; if the count for one class drops sharply while adjacent classes surge, it indicates that the decision boundary has shifted. This is consistent with the idea of a confusion matrix: without gold-standard labels, an anomaly can be detected by looking at the marginal distribution alone. In practice, teams can export the frequency table for each label after every evaluation and compare it with historical baselines or proportions estimated from manual sampling; a deviation exceeding a threshold triggers manual review. This method does not rely on additional model calls and is suitable for embedding into existing evaluation pipelines as a pre-check.
Order-of-Magnitude Gaps
On two corpora each containing 900 responses, across a total of eight judges, the compliance rate differed by 22 to 25 times between judges; the gap in non-refusal rate was also 18 to 23 percentage points. Even after excluding the three collapsing judges, the compliance rate on the remaining four corpora still differed by 1.7 to 2.8 times, and the non-refusal rate differed by 10 to 22 percentage points.
This shows that judge disagreement is not noise caused by a few "bad judges" but a pervasive methodological problem. You may not have noticed that even if each judge is called only once, these results remain unchanged—the collapse is not statistical fluctuation caused by multiple sampling.
Non-Refusal Rate: More Stable but Not Fully Consistent
The study also compared the "non-refusal rate" metric. Its cross-judge disagreement is additive and milder than the multiplicative difference in compliance rate, but still cannot be ignored. The authors therefore recommend: when reporting compliance rates, also attach the label counts for each category and the name of the judge used, and report the non-refusal rate as a parallel metric.
This "minimum reporting requirement" is not complicated, yet it can expose judge collapse. For teams that rely on automated scoring for safety evaluation, this is a low-cost, high-benefit improvement.
The difference between the compliance rate and the non-refusal rate lies in their statistical nature: the compliance rate is "number of compliant responses / total responses," with a fixed denominator, and differences between judges appear multiplicative (ratios can reach tens of times); the non-refusal rate usually refers to the proportion of responses in which the model does not explicitly refuse, counting "compliant" and "evasion" and other non-refusal categories together, so it is insensitive to misjudgments between adjacent classes, and differences appear additive (percentage-point differences). This makes the non-refusal rate more robust under judge disagreement, but also coarser-grained—it cannot distinguish "provided harmful content" from "vaguely sidestepped the question," and carries less safety information. Reporting the two together can reflect the overall refusal tendency while also exposing the instability of fine-grained compliance judgments.
Implications for Jailbreak Evaluation
The core reminder of this work is: the attack success rate is not an inherent property of the target model but a joint product of "target model × judge." When the judge silently classifies compliant responses as evasion, the impressively low success rates in papers may simply be the judge's blind spot.
For teams doing red team testing and safety benchmarks, at least two things should be done: first, disclose the identity of the judge; second, disclose the counts for each label category. The former makes results reproducible, and the latter leaves collapse nowhere to hide.
One-line Summary
Swapping only the judge can make jailbreak compliance rates differ by 22 to 25 times, with judge collapse as the main cause.
Paragraph Summary
This study reveals an overlooked variable in jailbreak evaluation: the judge that scores responses. Holding the target model, prompts, and responses fixed and changing only the 8B/9B judges from three model families, the authors found that three judges systematically classify clearly "compliant" responses into the adjacent "evasion" class, forming "class collapse," with one never labeling any of 900 responses as "compliant." Across different judges, compliance rates differ by 22 to 25 times and non-refusal rates by 18 to 23 percentage points; even after excluding collapsing judges, gaps of 1.7 to 2.8 times remain. The study proposes using per-category label counts as a zero-cost diagnostic signal, and recommends attaching category counts and the judge's name when reporting compliance rates and reporting non-refusal rates in parallel. The core conclusion is: attack success rate is a joint product of "target model × judge," not an inherent safety property of the model.
Related articles

GitHub Daily · October 23: Agent Runtimes and Skill Libraries Surge on the Same Day
NVIDIA open-sources OpenShell, a Rust security runtime for autonomous agents; Claude-Red turns security methodology into SKILL.md skills; VoxCPM2 drops the tokenizer.

Build an AI Super Employee System at Zero Cost: A Full Breakdown of Automated Agent Workflows
A deep breakdown of the AI super employee system demoed on Bilibili: agent orchestration, digital human voiceovers, map and enterprise lead generation, 24/7 customer service, and legal modules. We analyze the business logic and compliance risks behind zero-cost signup to help entrepreneurs judge the real ROI of this AI digital employee system.

The Essential Difference Between Chatbots and AI Agents: Crossing from Conversation to Execution
What's the difference between a chatbot and an AI agent? Based on the MCP series on the Learn Tech channel, this article uses examples like booking flights and summarizing notes to explain: a chatbot only gives answers, while an agent actually completes tasks through a think-act-observe loop. It breaks down the four core components—model, tools, memory, and goal—as well as MCP's role as a bridge, and discusses agents' applicable boundaries and permission risks.