Mistral Time Series Model Hands-On: Latency Delivers, Confidence Intervals Collapse

Mistral's time series model has reliable point forecasts but severely miscalibrated confidence intervals, unsuitable for production alerting.
A developer tested Mistral's first time series foundation model, Timestral, verifying parameter naming from 5M to 209M matches official claims. On latency, the official 10ms is based on an 8-thread CPU; on 2 threads, the 5M model measured about 52ms and the 28M about 316ms, so capacity planning must account for actual thread count. Point forecast ability is convincing: the 5M model's zero-shot forecasting on airline passenger data achieved an MAE 37% lower than the seasonal naive baseline. But the core selling point of probabilistic forecasting has serious problems: the nominally 80% confidence interval actually covers only 16.7% of values, decaying with forecast horizon, and all median forecasts are systematically low. Quantile monotonicity is perfect, but interval expansion cannot keep pace with accumulating bias, making it unsuitable for production alert thresholds.
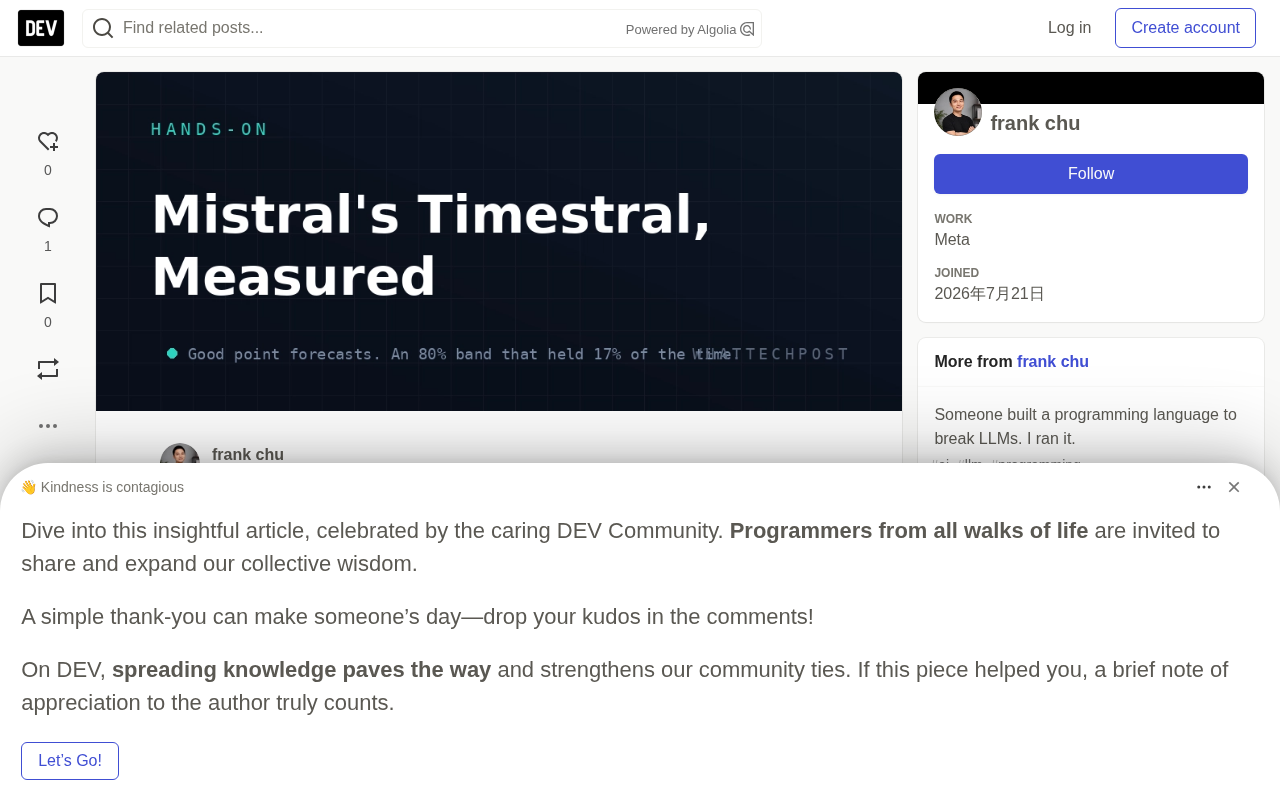
Mistral has released Timestral, its first family of time series foundation models, ranging from 5M to 209M parameters and supporting 21-quantile probabilistic forecasting with a context window of up to 32,768 steps. The company claims top rankings on three public forecasting benchmarks and cites attractive CPU latency figures. But one developer downloaded the public weights and ran the tests firsthand, discovering that while point forecasts are genuinely strong, the confidence intervals are far less reliable than advertised.
Honest Naming, but Latency Depends on Thread Count
The developer first verified the weight files on Hugging Face, and the parameter counts of all four models matched their names exactly (5M corresponds to 5.21M parameters, 209M to 209.32M). The 5M model's configuration also confirmed the official numbers: 21 quantile nodes from 0.01 to 0.99, a context length of 32,768, and a patch size of 32.
On latency, the official claim is that on a standard 8-thread server CPU, the 5M model needs only 10ms for a one-day-ahead forecast. The developer reproduced the same setup on a 2-vCPU VM (2,016-step context, 96-step forecast window) but limited torch to 2 threads. The result: a median of 52.4ms for the 5M model and 315.7ms for the 28M model.
This isn't fabrication. 10ms multiplied by the 4x thread difference is roughly 40ms, which is in the same ballpark as the measured 52ms. The key is understanding the precondition: "10ms" refers to an 8-thread server CPU. In a production sidecar environment with only 2 cores, you should budget 50ms per forecast for the small model and one-third of a second for the 28M model. If you're dealing with ten thousand sensors, that multiplication is your capacity planning.
Quantile monotonicity requires that the model's output quantiles increase monotonically with the probability level—i.e., the 0.1 quantile should not exceed the 0.9 quantile. Many probabilistic forecasting models approximate this constraint by predicting each quantile independently or using a non-crossing loss, but cannot guarantee it architecturally. Timestral shows zero crossings across 24×21 outputs, indicating that its output layer or loss design builds in a monotonicity constraint (e.g., via a cumulative distribution or ranking mechanism). Monotonicity is a necessary condition for interval validity, but far from sufficient—an interval can be strictly monotonic and still be too narrow. So perfect monotonicity does not offset the coverage miss; the two measure different dimensions.
Point Forecast Accuracy Is Convincing
The developer ran a zero-shot test on the classic airline passengers dataset: monthly data from 1949 to 1960, with the first 120 months as input and the last 24 months held out for validation. The 5M model's median forecast achieved an MAE of 44.93, compared with 71.25 for the seasonal naive baseline and 91.62 for the drift baseline.
A 5M-parameter model that has never seen this series achieving an MAE 37% lower than the seasonal naive method is a credible, real result. The median forecasts for the first six months track the actual values closely (348 vs. 360, 332 vs. 342, 375 vs. 406), showing solid foundational forecasting ability.
The seasonal naive baseline is the most commonly used benchmark in time series forecasting: for monthly data, it simply uses the observation from the same month last year as the forecast. Its MAE of 71.25 means an average absolute error of about 71 units. The drift baseline extrapolates from a line connecting the first and last points and performs worse in this case (91.62). The zero-shot model beats both with an MAE of 44.93, showing that it has genuinely learned general patterns across series rather than merely memorizing. However, a zero-shot test on a single classic dataset (airline passengers) is only preliminary evidence; comprehensive benchmarks like GIFT-Eval, which cover series across multiple frequencies and domains, better reflect generalization ability. Readers should treat this result as a "credible positive signal," not a comprehensive proof of performance.
Confidence Intervals Are Severely Miscalibrated
The problem lies in the core selling point of probabilistic forecasting. Timestral claims that "teams can see how wide the uncertainty is and set alert thresholds accordingly." The developer checked the 80% interval coverage between the 0.1 and 0.9 quantiles.
The result is striking: out of 24 months, only 4 actual values fell within the 80% interval—a coverage rate of 16.7%. Worse, coverage decays with forecast horizon—25% for the first 12 months and 8.3% for the last 12. All 24 median forecasts were below the actual values, with a constant bias of -44.93. Although the interval width expanded from 36 to 101, the expansion could not keep pace with the accumulating bias.
An interval nominally at 80% that actually covers only 17% of true values is not an uncertainty estimate—it's an ornament. The only structural promise perfectly fulfilled is quantile monotonicity: zero crossings across 24 by 21 outputs, consistent with the architectural claim.
Two caveats are in order: this is a single monthly series with an unusually clean trend, not a comprehensive evaluation like GIFT-Eval; and Mistral's benchmark results were submitted to a public leaderboard that anyone can check. In addition, the company acknowledges that the model was primarily pretrained on synthetic data and may indeed have seen few real-world trends with sustained compounding growth.
But that is precisely the problem: the official announcement uses capacity planning and risk thresholds to argue for the model's value, and in those scenarios, a miscalibrated interval is more dangerous than no interval at all. The point forecast tells you 348, the interval tells you not to worry, but reality keeps reporting 360, 342, 406—always in the same direction.
Quantile calibration and coverage are core metrics for evaluating probabilistic forecasts. A prediction interval nominally at 80% should theoretically contain about 80% of true observations—a property called calibration. The coverage rate is the actual proportion of observations falling within the interval; if it is significantly below the nominal level, the model systematically underestimates uncertainty (intervals too narrow) or has a directional bias. Common diagnostic tools include PIT histograms, reliability diagrams, and coverage curves grouped by forecast horizon. Note that coverage tests are sensitive to sample size: 24 points from a single series provide only a rough signal, but are still enough to expose severe miscalibration. In production, intervals that are too narrow are more harmful than intervals that are too wide, because they tempt you to set alert thresholds too tight, leading to frequent missed detections.
Advice for Users
The latency figures are credible, but remember the thread-count asterisk. Point forecasts are credible—the 5M model's zero-shot MAE being 37% lower than seasonal naive is a genuine achievement. The quantile intervals, however, should not be used directly for production alerting—measure coverage on your own series before setting any threshold. That measurement takes only eleven lines of code, and it is precisely what separates a press release from a usable product.
Mistral's weights are released under Modified MIT, with inference code under Apache 2.0. The tester only ran the 5M and 28M models, not the 123M and 209M. The code and environment details are reproducible.
Related articles

Free Unlimited Claude Code Solution: Agnes AI + CC Switch Setup Guide
No paid subscription needed — pair the free AI platform Agnes AI with the open-source tool CC Switch to provide a backend for Claude Code, enabling unlimited free calls to text, image, and video models. This guide covers the full setup, test results, and usage boundaries.

A Complete Zero-Cost Guide to Getting Started with Claude Code for Beginners in China
A beginner's guide to Claude Code for users in China: two installation methods (command line and IDE plugin), full configuration steps for replacing the official API with the free domestic LongCat model, and a hands-on demo of building a small tool with natural language, plus tips.

When the NSA Gets Involved: The AI Supply Chain Crisis Behind Open-Source CVEs and API Key Hijacking
Multiple open-source projects disclosed severe CVEs in one day, PHP flaws alarmed the FBI, and Railway and OpenCode were breached with API keys stolen. This article breaks down the vulnerability window, AI-accelerated exploitation, and the AI supply chain crisis behind the API key black market, with a developer defense checklist.