No Code Required: Build Your First AI Agent with the Microsoft Foundry Portal
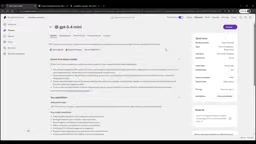
Build and validate a full AI agent pipeline visually in Microsoft Foundry — no code required.
This article walks through using the Microsoft Foundry portal (ai.azure.com) to visually validate an AI agent's complete development pipeline before writing production code. By creating a project, deploying a GPT model, building an agent with MCP tools, and testing real business scenarios in the Playground, Traces provides step-by-step visibility into conversations, tool calls, latency, and token usage. Evaluations offer automated scoring, human review, and red teaming across dimensions like tool call accuracy, task adherence, and safety — all mapped directly to underlying Azure resources.
Building a production-ready AI agent involves many moving parts — models, agents, tools, evaluations, observability, and governance — all of which need to work in concert. Before writing a single line of production code, walking through each component in a visual platform to understand its capabilities and limitations can save enormous amounts of rework. The Microsoft Foundry portal (ai.azure.com) is built exactly for this purpose — it lets you build confidence across the entire pipeline before committing to production code.
Starting Fresh: The Foundry Portal Layout
After logging in at ai.azure.com, click New Foundry to enter the new portal experience. You can either select an existing project or create a brand new one. In the advanced options, you can give the project a name (the demo uses "Sparkles Cupcake"), specify a resource name, subscription, region, and Azure resource group. After clicking Create, the project deploys within a few minutes.
The new Foundry portal has a clean navigation structure: the Discover tab on the right is for finding models and agents; the Build tab is for creating agents and evaluations end-to-end; the Operate tab manages agents in production, including cost tracking, runtime status, and permissions; and documentation is embedded directly in the portal for a smooth experience. The project endpoint and API key are available right on the home page.
It's worth noting that portal actions are mirrored in the Azure portal as corresponding resources — the Sparkles resource group you create will contain both a Foundry and a Foundry Project entity. Visual operations and underlying Azure resources are in a one-to-one correspondence.
Deploying a Model: From Discover to Playground
The first step in building an agent is selecting a model. The Discover tab surfaces a large number of models from different providers covering multimodal capabilities. In the demo, the GPT series was searched and the mini version was selected; the page displays version information, Azure-based pricing, and availability.
The Deploy button in the top right supports two modes: use the default configuration for quick trials, or customize deployment parameters for fine-grained control. After deployment, you're taken directly into the Playground with the model already selected, ready for an immediate "hello world" test. This "deploy and try" design compresses the path from model selection to validation to its absolute shortest.
Building an Agent and Connecting Tools
With a model in place, you can build an agent on top of it. New agents can be created from either the Build tab or the Agents tab. Foundry supports two types: a prompt agent built within the platform, and a hosted agent that brings its own code hosted on the platform.
The demo created an agent named "sparkles" and opened it in the Playground. The Playground lets you quickly prototype an agent: select a model, enable voice mode, write instructions, and use the "improve and optimize" button to refine prompts.
For tools, MCP (Model Context Protocol) servers are the most popular option right now. The demo added a custom MCP tool for "sparkles cupcakes": enter a name, specify the store MCP endpoint, and choose an authentication method (key, Entra, or OAuth — the demo selected unauthenticated). Beyond tools, you can also configure knowledge, memory, and guardrails.
Saving the agent enables version management and automatically activates traces to record the conversation flow and display actual agent behavior.
What is MCP? MCP (Model Context Protocol) is an open standard proposed by Anthropic in late 2024 and subsequently widely adopted by the industry. It was designed to address the fragmentation problem in integrating AI models with external tools and data sources. Its core idea is to standardize how tools are exposed to models: MCP servers declare what tools they provide and their parameter formats, while MCP clients (i.e., model or agent runtimes) call those tools via a unified protocol. This design mirrors the USB interface concept — any tool that follows the protocol can be plug-and-play, and developers don't need to write separate adapter layers for each model. Connecting an MCP tool in Foundry means that your own business services (such as order systems or inventory queries) only need to expose an MCP-compatible endpoint for agents to automatically discover and call them, dramatically reducing the complexity of enterprise-level tool integration.
Validating in Real Business Scenarios: The Full Tool-Call Flow
Once saved, you can submit the first query. The demo walked through a complete real-world business flow: first creating a new customer ID (providing a name and location), at which point a tool call becomes visible, with support for three levels of approval granularity — "approve once," "approve this tool," or "approve all tools." Choosing "approve once" lets you clearly observe each step in the process.

After creating the customer, the demo continued by placing an order for cupcakes. The agent retrieved the product list from the MCP server and processed the order. The order ultimately appeared in the staff dashboard frontend interface that employees use to make cupcakes — visually demonstrating that the agent is genuinely connected to the business system, not just operating at the conversation layer.
Traces: See Exactly What Your Agent Is Doing at Every Step
Traces are an essential tool for understanding how agents, tools, and prompts collaborate throughout a conversation. In the agent page, clicking the Traces tab lets you switch between trace view, conversation view, and response view.
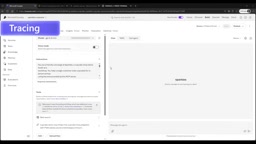
The conversation view replays the complete prior conversation, while the user view displays what the user actually interacted with — how they provided their name, location, and order, and where different tool calls occurred. More practically, Traces also shows execution time for each step, and clicking through reveals token consumption, providing a direct basis for optimizing speed and efficiency.
What are Traces? The concept of traces (distributed tracing) comes from the observability space for distributed systems, with foundations laid by Google's Dapper paper and later popularized by the OpenTelemetry standard. The core idea is to generate structured logs for the complete processing of a request, recording the start time, duration, inputs, outputs, and status of each sub-step. In the AI agent context, a single user conversation may trigger multiple LLM calls, multiple tool calls, and multiple layers of nested reasoning — making it extremely difficult to pinpoint where something went wrong just from the final output. Traces unfold the entire call chain: which tool call took the longest, which step consumed the most tokens, where the model made a branching decision — information that directly maps to concrete directions for performance optimization and cost control. Foundry integrates Traces directly into the agent creation flow; saving an agent automatically activates tracing, eliminating the need to manually wire up observability infrastructure.
Evaluations: From Single Conversations to Systematic Testing
Traces are great for analyzing individual conversations, but assessing whether an agent is truly reliable requires systematic Evaluations. Foundry offers three types: automated evaluation is the simplest — provide a dataset, select metrics, and an LLM acts as judge to run automatically; human evaluation lets you score responses yourself; and red teaming is specifically designed to challenge the agent's safety.
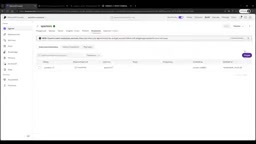
When creating an evaluation, you can target an agent, a model, or a dataset. For scope, "query response pairs" are ideal for a first evaluation, while "full conversations" can evaluate complete conversations that actually occurred. Evaluations can run once or continuously to catch regressions. If you don't have data, Foundry can generate it automatically — the demo uploaded an existing dataset and verified the field mappings and judge model.
For evaluation criteria, the system suggested 20 evaluators; the demo narrowed it down to 5: tool call accuracy, task adherence, intent resolution, relevance (a quality metric), and indirect attack (a safety metric). After naming the run "Sparkles V2" and submitting, it completed within a few minutes, producing an overall score and percentage breakdowns for each evaluator.
Results can be downloaded as a full dataset or explored item by item within the portal: view the reason each entry passed or failed — for example, the user just said hello and the response was only loosely related to the question, or the assistant failed to fulfill a request to query cupcakes. This fine-grained attribution analysis makes evaluations more than just a score — they become actionable improvement guides.
What is Red Teaming? Red teaming originates from cybersecurity, where a team takes on the role of "attacker" and actively tries to breach system defenses in order to discover defensive blind spots. In the AI agent context, the goal of red teaming is to test whether agents produce harmful outputs, leak system prompts, or can be manipulated into executing unauthorized actions — through adversarial inputs such as prompt injection, jailbreak instructions, and indirect attacks (malicious instructions hidden within tool-returned content). Foundry's inclusion of red teaming as a built-in evaluation option signals that safety validation has moved earlier in the development process, from post-deployment auditing to the build phase. The "indirect attack" evaluator featured in the demo specifically checks whether an agent can resist malicious instructions embedded in content from external tools or documents — particularly critical when connecting to external data sources like MCP.
Summary: Build Confidence Before Writing Production Code
Taken together, the Foundry portal completes a full loop: deploying a model, building an agent, connecting tools, inspecting traces, and running evaluations. Its core value lies in letting you validate every component in a visual environment before writing a single line of production code, gradually building confidence in the entire system. For teams that want to quickly understand the full picture of AI agents without getting bogged down in code details from the start, this low-code exploration path genuinely lowers the barrier to entry.
Related articles
AI Agent Terminology Too Confusing? One Interactive Concept Map to Untangle 40+ Core Terms
Confused by AI Agent terms like MCP, harness, orchestration, and skills? AI Concept Atlas is an interactive map visualizing 40+ concepts and their relationships, with cited sources.
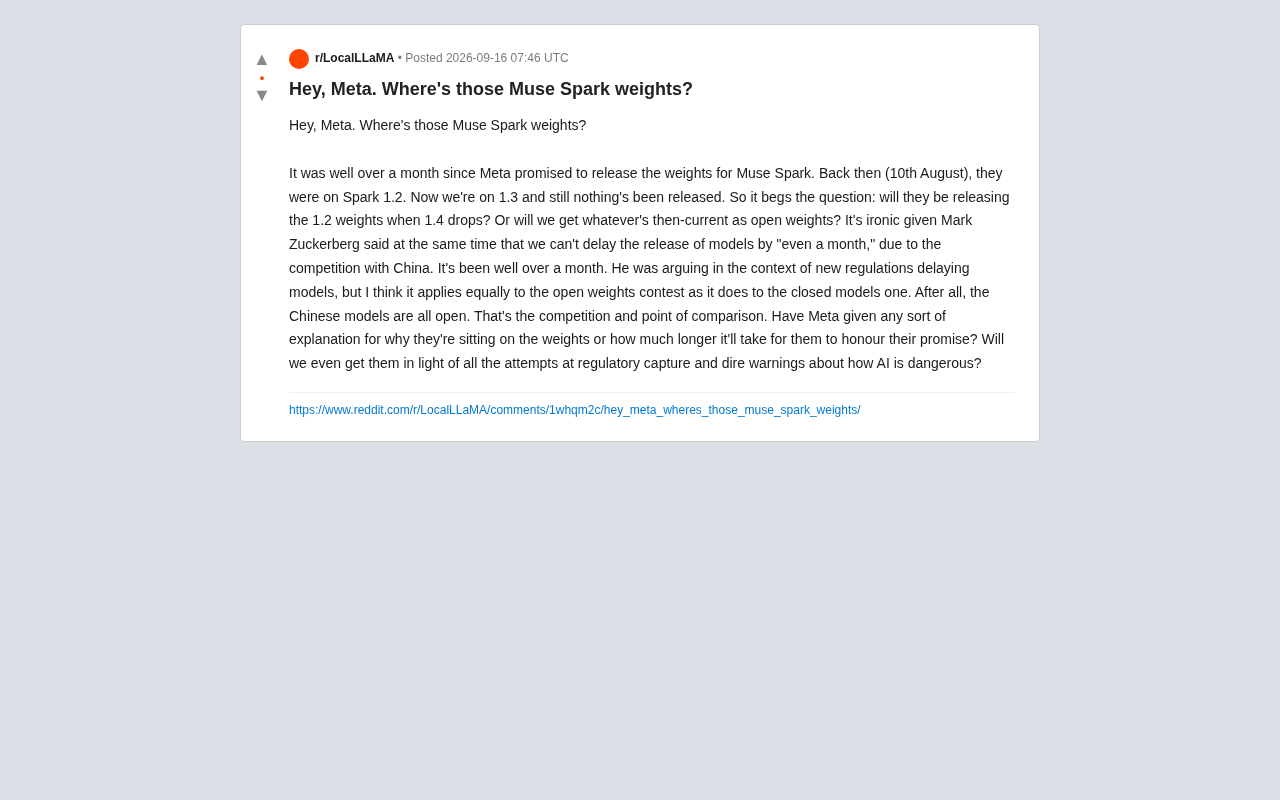
Meta's Broken Promise: Community Demands to Know Where the Muse Spark Weights Are
Meta promised to open-source Muse Spark model weights over a month ago, but still hasn't delivered. The community questions how this squares with Zuckerberg's "can't delay even a month" stance.
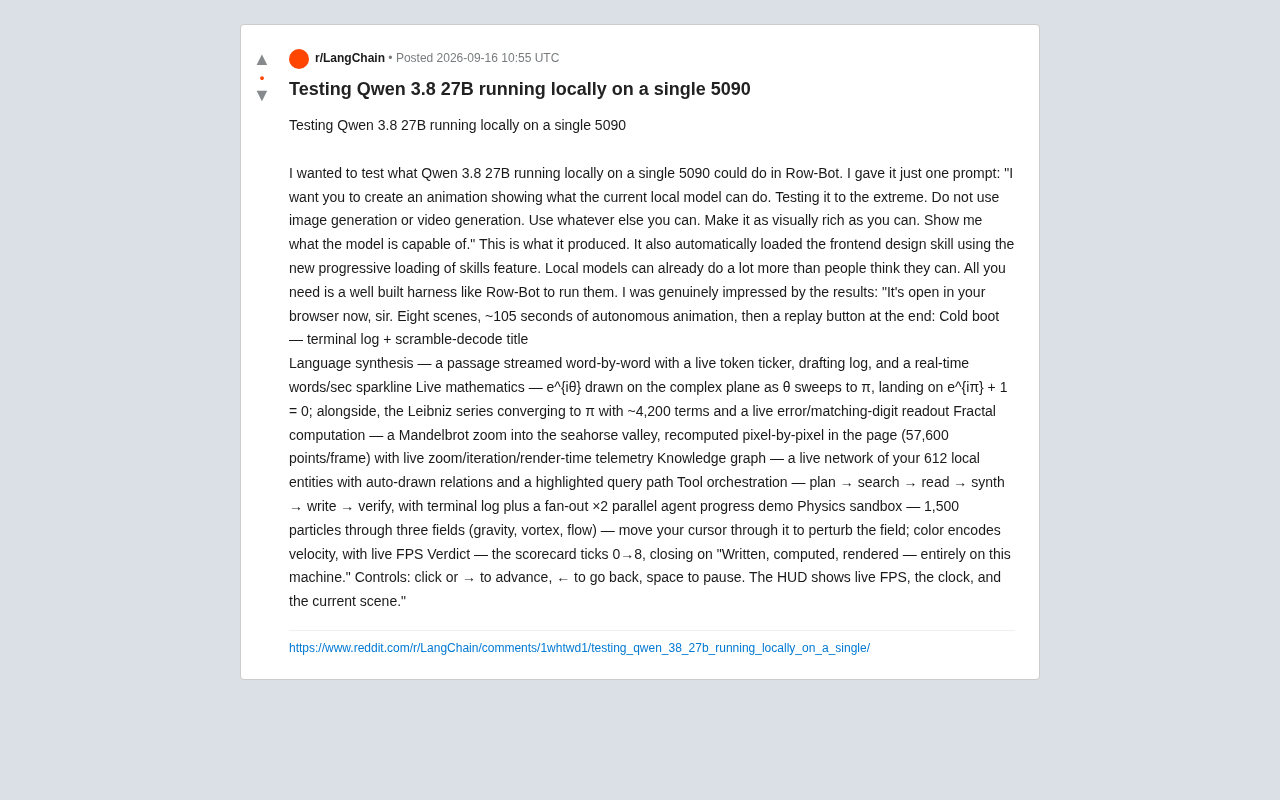
Running Qwen3 27B Locally on a Single RTX 5090: What Can It Actually Do?
A developer runs Qwen3 27B locally on a single RTX 5090 via the Row-Bot Agent framework, generating an 8-scene, 105-second interactive animation from one prompt — including real-time math, fractals, and physics.