Real-Time 3D Satellite Tracking & Declassified UFO Archives: A Deep Dive into Open Data Visualization

An open-source project combining real-time 3D satellite tracking with Pentagon declassified UFO archives for rational UAP investigation.
This article analyzes an open-source project that merges real-time 3D satellite orbit tracking with Pentagon-declassified UFO archives. It covers the technical foundations including TLE data parsing, SGP4 propagation algorithms, and WebGL visualization using Three.js and CesiumJS, while exploring how cross-referencing satellite transit data with UAP sighting reports enables rational source tracing of unidentified aerial phenomena.
Project Overview: The Cross-Domain Fusion of Satellite Tracking and UFO Archives
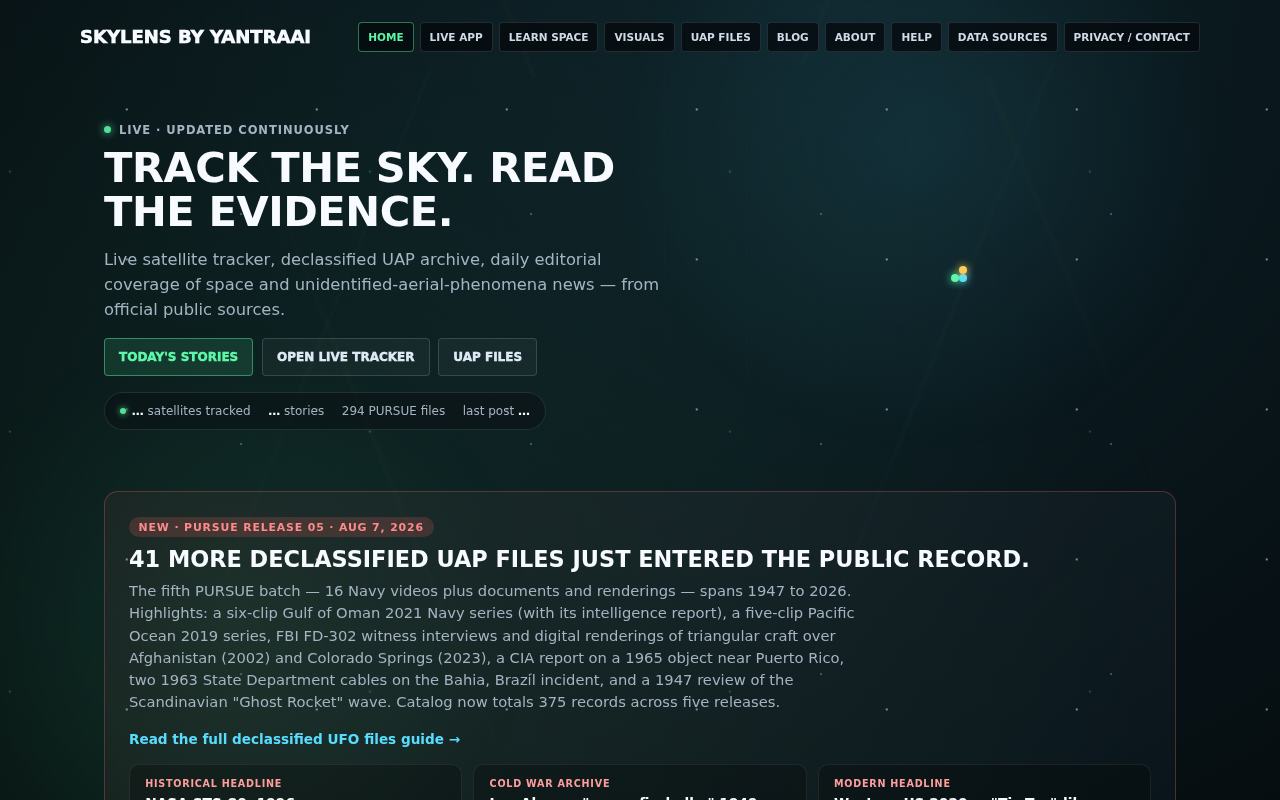
An open-source project called "Live 3D Satellite Tracker" recently appeared on Hacker News' Show HN section. This project cleverly combines two seemingly unrelated domains: real-time 3D satellite orbit tracking and Pentagon-declassified UFO archives. While the project is still in its early stages of gaining attention, the technical direction and data integration approach it demonstrates are quite inspiring.
The core value of projects like this lies in presenting originally obscure public data—whether satellite orbital parameters or declassified government documents—to ordinary users through intuitive visualization. As government data becomes increasingly open, helping the public more efficiently understand massive amounts of information has become an important topic in the developer community. The core philosophy of the Open Data Movement is that data collected and maintained with public funds should be made available to the public in machine-readable, unrestricted formats. This philosophy achieved an institutional breakthrough after the U.S. federal government launched Data.gov in 2009, followed by similar open data portals established by the EU, UK, Japan, and others. However, open data doesn't equal accessible information—vast amounts of public datasets are stored in CSV, XML, or specialized binary formats, lacking contextual explanations and visualization interfaces, making them virtually unusable for non-specialist users. This has spawned a "translation layer" ecosystem between government data infrastructure and end users, built by independent developers, news organizations, and nonprofits creating visualization tools and interactive interfaces. Projects like satellite trackers are typical representatives of this ecosystem—they don't produce data but transform public data into perceivable experiences, turning "open" into truly "understandable."
Technical Principles of Real-Time 3D Satellite Tracking
TLE Data: The Foundation of Satellite Positioning
The technical core of real-time satellite tracking is TLE (Two-Line Element Set). This is a standardized data format maintained and publicly released by the North American Aerospace Defense Command (NORAD), used to describe the orbital parameters of Earth-orbiting objects, including orbital inclination, eccentricity, argument of perigee, and other key elements.
The TLE format was originally developed by NORAD during the Cold War to track Soviet satellites. Each dataset contains two lines of 69 encoded characters. The first line includes the satellite number, international designator, epoch time, first and second time derivatives of mean motion, BSTAR drag coefficient, and other parameters; the second line records orbital inclination, right ascension of the ascending node, eccentricity, argument of perigee, mean anomaly, and revolutions per day. This compact text format became the universal language for satellite data exchange even before the internet became widespread, and it remains widely adopted by space agencies worldwide.
Developers typically obtain real-time TLE data from public sources like CelesTrak or Space-Track.org, then use the SGP4/SDP4 orbital propagation algorithms to calculate a satellite's three-dimensional spatial position at any given moment. The SGP4 (Simplified General Perturbations 4) algorithm was finalized and published by the U.S. Air Force in the 1980s. Building on a simplified Earth gravity field model, it accounts for major perturbation factors including J2 through J4 zonal harmonics, atmospheric drag, and solar-lunar gravitational effects, enabling reasonably accurate prediction of satellite positions over the next several days without requiring high-performance computing. SDP4 is its deep-space extension, specifically designed for high-orbit objects with orbital periods exceeding 225 minutes. It's worth noting that TLE data has inherent precision limitations—for low-orbit satellites, outdated TLE data can accumulate position errors of several kilometers per day, which is why frequent data updates are so important. Currently, there are tens of thousands of trackable objects in Earth orbit, encompassing active satellites, retired satellites, and space debris.
Mainstream Technology Stacks for 3D Visualization
Common technical approaches for implementing 3D satellite visualization on the web include:
- Three.js / WebGL: Used to build 3D Earth models and render satellite orbit paths, offering high flexibility and rich community resources
- CesiumJS: A 3D visualization engine specifically designed for geospatial data, with built-in coordinate system transformations, timeline animations, and other features suited for GIS scenarios
- satellite.js: A lightweight satellite orbit computation library that supports TLE parsing and real-time position calculation directly in the browser
Three.js is a general-purpose 3D rendering library that gives developers great freedom to define scenes, cameras, and interaction logic, but this also means handling geographic coordinate system conversions (such as the WGS84 ellipsoid model to 3D Cartesian coordinates), hierarchical terrain tile loading, and timeline-driven animation systems on their own. CesiumJS is an open-source project initiated by AGI (Analytical Graphics, Inc.), designed specifically for geospatial visualization with native support for 3D Tiles, CZML temporal data formats, terrain, and imagery layers. A major advantage of CesiumJS is its precise double-precision floating-point rendering pipeline—standard WebGL uses single-precision floating-point numbers, which produces noticeable jittering artifacts when rendering Earth-scale scenes. CesiumJS solves this through GPU-side Relative-to-Center (RTC) rendering techniques. For applications like satellite tracking that need to seamlessly switch between Earth surface and space scales, CesiumJS is typically the less labor-intensive choice, though its approximately 4MB core bundle size and steeper learning curve are factors to weigh.
With these tools, developers can render the trajectories of thousands of satellites in real-time within a browser. Users can freely rotate the Earth view, click to inspect individual satellite orbital parameters and basic information, and enjoy an immersive space exploration experience.
Data Integration of Declassified UFO Archives
Pentagon's Public UAP Documents
In recent years, the U.S. Department of Defense has progressively released a series of investigation archives related to "Unidentified Aerial Phenomena" (UAP, formerly known colloquially as UFOs). The U.S. Navy has officially confirmed the authenticity of multiple UAP videos, and the "All-domain Anomaly Resolution Office" (AARO) has continuously published investigation reports, gradually bringing previously classified materials into public view.
The U.S. government's institutionalized investigation of UAP has gone through several key milestones. In 2017, The New York Times exposed the Department of Defense's secret "Advanced Aerospace Threat Identification Program" (AATIP), which ran from 2007 to 2012 with a budget of approximately $22 million. In 2020, the DoD officially established the "Unidentified Aerial Phenomena Task Force" (UAPTF). In 2022, Congress passed the National Defense Authorization Act upgrading it to the "All-domain Anomaly Resolution Office" (AARO), expanding its jurisdiction from aerial to maritime and space domains. AARO has published multiple public reports, and as of its latest statistics in 2024, its database contains hundreds of unresolved cases. Meanwhile, in 2023 NASA also established an independent UAP research director position, conducting investigations from a scientific rather than defense perspective. This series of institutional changes means that large amounts of archives previously scattered across different departments and stored at various classification levels are being systematically organized and declassified, providing unprecedented material for third-party data integration projects.
Digitizing, structuring, and providing search functionality for these declassified archives is a major highlight of this project. It organizes documents scattered across different government websites—existing as scanned PDF files—into a searchable, browsable online archive, significantly lowering the barrier to public access.
Cross-Verification of Satellite Data and UAP Archives
Placing satellite tracking and UFO archives on the same platform implies a noteworthy logic: many so-called "unidentified flying object" sighting events can actually be explained by cross-referencing satellite transit records from that time. The most typical example is that SpaceX Starlink satellite formations creating "Starlink trains" in the night sky have been repeatedly mistaken for UFOs by observers in various locations.
SpaceX began large-scale deployment of its Starlink internet satellite constellation in 2019, with over 6,000 satellites in orbit as of 2024. In the first few days after each batch launch, Starlink satellites travel in tight formation along the same orbital plane, appearing to ground observers as a line of slowly moving bright points—the so-called "Starlink train." Since these satellites operate in low orbit (approximately 550 km altitude), sunlight reflection gives them an apparent magnitude of 1 to 3, clearly visible to the naked eye. According to statistics from the International Meteor Organization and multiple observatories, Starlink-caused UAP false reports surged dramatically after 2020, with more than one-third of UFO hotline reports in some regions ultimately confirmed as Starlink satellites. Additionally, while Iridium Flares have decreased due to the retirement of first-generation Iridium satellites, unexpected flashes from other high-reflectivity satellites and rocket upper stage debris remain common sources of misidentification. The ability to query satellite transit records for specific times and locations in real-time has practical falsification value for ruling out such misidentifications.
By giving users simultaneous access to real-time satellite position data and historical sighting archives, tools like this provide a pathway for rational source tracing—helping people distinguish which phenomena can be explained by known artificial orbital objects and which are genuinely anomalous events worthy of further investigation.
Significance and Challenges Facing the Project
Public Value of Open Data
Whether it's NORAD satellite orbital data or Pentagon declassified documents, these are fundamentally public information produced with taxpayer funding. However, the barrier to using raw data is very high, making it difficult for ordinary people to directly read and utilize. The core significance of visualization tools like this project lies in reducing the cost for the public to access and understand information, which aligns closely with the philosophy of the Open Data Movement.
Technical and Content-Level Challenges
Projects of this nature face several key challenges in practical operation:
- Data timeliness: TLE data requires frequent updates (typically every few hours to one day), otherwise orbital predictions will become inaccurate due to accumulated errors
- Frontend performance optimization: Simultaneously rendering tens of thousands of dynamically moving 3D objects in a browser is a massive test of WebGL performance and memory management
- Content authority: UFO-related topics are easily mixed with unverified rumors and speculation; ensuring the authority of archive sources and neutrality of presentation is a content governance challenge
Regarding frontend performance, drawing individual 3D satellite models one by one produces numerous draw calls that quickly overwhelm the GPU's command processing bottleneck. Common optimization strategies in the industry include: using Instanced Rendering to pack all satellite position data into a single buffer and complete all rendering in one draw call; adopting GPU particle systems that write orbital calculation logic into shaders, leveraging the GPU's parallel computing capability to update positions each frame; implementing Frustum Culling and Level of Detail (LOD) strategies to reduce rendering precision or completely skip satellites outside the viewport or at greater distances. Additionally, Web Workers can offload TLE parsing and SGP4 calculations from the main thread to avoid blocking UI rendering. The gradual advancement of the WebGPU standard in recent years also brings new possibilities for such applications—it provides lower-level GPU access and compute shader support compared to WebGL, theoretically enabling satellite position updates to run entirely on the GPU, further freeing CPU resources.
Technical Possibilities for Independent Developers
This project appeared on Hacker News as an individual or small team effort, reflecting a current trend in independent development: leveraging public APIs, mature open-source libraries, and modern web technology stacks, a single developer can quickly build complex 3D visualization products that previously required professional teams. This low-cost, high-output model is spawning an increasing number of creative data-driven projects.
Conclusion: Using Technology to Make the Mysterious Transparent
The "Live 3D Satellite Tracker + UFO Archives" project, while still relatively niche, represents a valuable direction: using visualization technology to make complex data perceivable and explorable. It serves both as a practical space observation tool and as an information platform with science communication and rational source-tracing capabilities.
For developers, this project provides clear technical reference—a complete pipeline from public data source integration, TLE orbital computation, to WebGL 3D rendering. For ordinary users, it's a window to understanding the sky above their heads. In an age of information overload, the effort to transform complex data into intuitive experiences deserves more attention and participation.
Related articles

Free Unlimited Claude Code Solution: Agnes AI + CC Switch Setup Guide
No paid subscription needed — pair the free AI platform Agnes AI with the open-source tool CC Switch to provide a backend for Claude Code, enabling unlimited free calls to text, image, and video models. This guide covers the full setup, test results, and usage boundaries.

A Complete Zero-Cost Guide to Getting Started with Claude Code for Beginners in China
A beginner's guide to Claude Code for users in China: two installation methods (command line and IDE plugin), full configuration steps for replacing the official API with the free domestic LongCat model, and a hands-on demo of building a small tool with natural language, plus tips.

When the NSA Gets Involved: The AI Supply Chain Crisis Behind Open-Source CVEs and API Key Hijacking
Multiple open-source projects disclosed severe CVEs in one day, PHP flaws alarmed the FBI, and Railway and OpenCode were breached with API keys stolen. This article breaks down the vulnerability window, AI-accelerated exploitation, and the AI supply chain crisis behind the API key black market, with a developer defense checklist.