Revived After Eight Years: datasette-vega 0.7 Now Works with Datasette Lite
After eight years dormant, the Datasette chart plugin datasette-vega releases 0.7 with restored compatibility and in-browser charting.
datasette-vega is one of the oldest plugins in the Datasette ecosystem, rendering charts for tables and query results based on Vega-Lite, but it hadn't been updated for nearly eight years since July 2018. Version 0.7's core goal is compatibility with the latest Datasette alpha and adaptation for Datasette Lite—which now supports running JavaScript plugins, enabling in-browser charting without a local Python environment. The plugin supports Bar, Line, and Scatter chart types, with dropdowns for X/Y columns and types, plus color and size mappings, positioning itself for rapid data exploration rather than publication-grade visualization. This update restores usability with minimal changes and adds no new chart features, reflecting the maintainer's restraint.
A Forgotten Plugin, Suddenly Revived
datasette-vega is one of the oldest plugins in the Datasette ecosystem, designed to render charts for data tables or custom query results using Vega-Lite under the hood. Its last release was in July 2018, with no updates for nearly eight years since. In the release notes, author Simon Willison candidly calls it Datasette's "longest-untouched plugin."
The motivation behind version 0.7 is clear: compatibility with the latest Datasette alpha, along with some visual tweaks to make it work better in Datasette Lite. This isn't a feature leap—it's "life-support" maintenance, pulling a tool that had been shelved for too long back into a usable state.
Datasette is an open-source data exploration and publishing tool developed by Simon Willison. Its core idea is to expose SQLite databases through a web interface, supporting filtering, sorting, pagination, and full-text search on tables, and allowing users to write arbitrary SQL queries directly. It's distributed as a Python package and can be started with a single command, datasette serve data.db, and also provides a JSON API for programmatic access. Datasette's plugin system is central to its ecosystem: plugins can be written in Python (extending server-side behavior) or in JavaScript (extending front-end interaction). datasette-vega falls into the latter category.
Compatibility Fixes Are the Core, Datasette Lite Is the Highlight
Keeping Pace with Datasette Alpha
Datasette itself is continuously evolving, and old plugins that go long without updates can easily break due to API or front-end behavior changes. The primary task of 0.7 is to get datasette-vega running again on the latest alpha. For existing users still relying on this plugin, this means they no longer need to lock themselves to an older version of Datasette.
Charting Directly in the Browser
More noteworthy is the support for Datasette Lite. Datasette Lite is a version of Datasette that runs in the browser, and previously it couldn't load JavaScript plugins. The author reveals that Datasette Lite has just gained the ability to run such JS plugins, and datasette-vega happens to be a beneficiary.
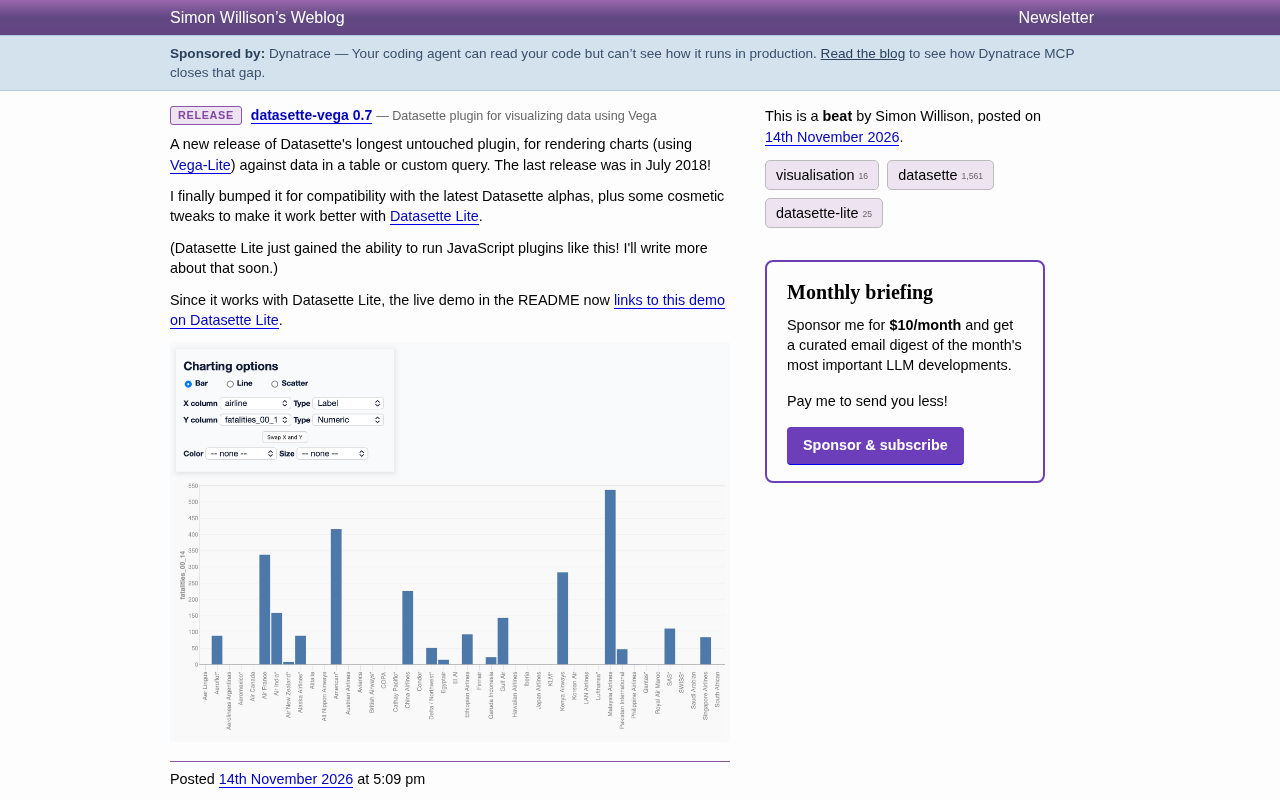
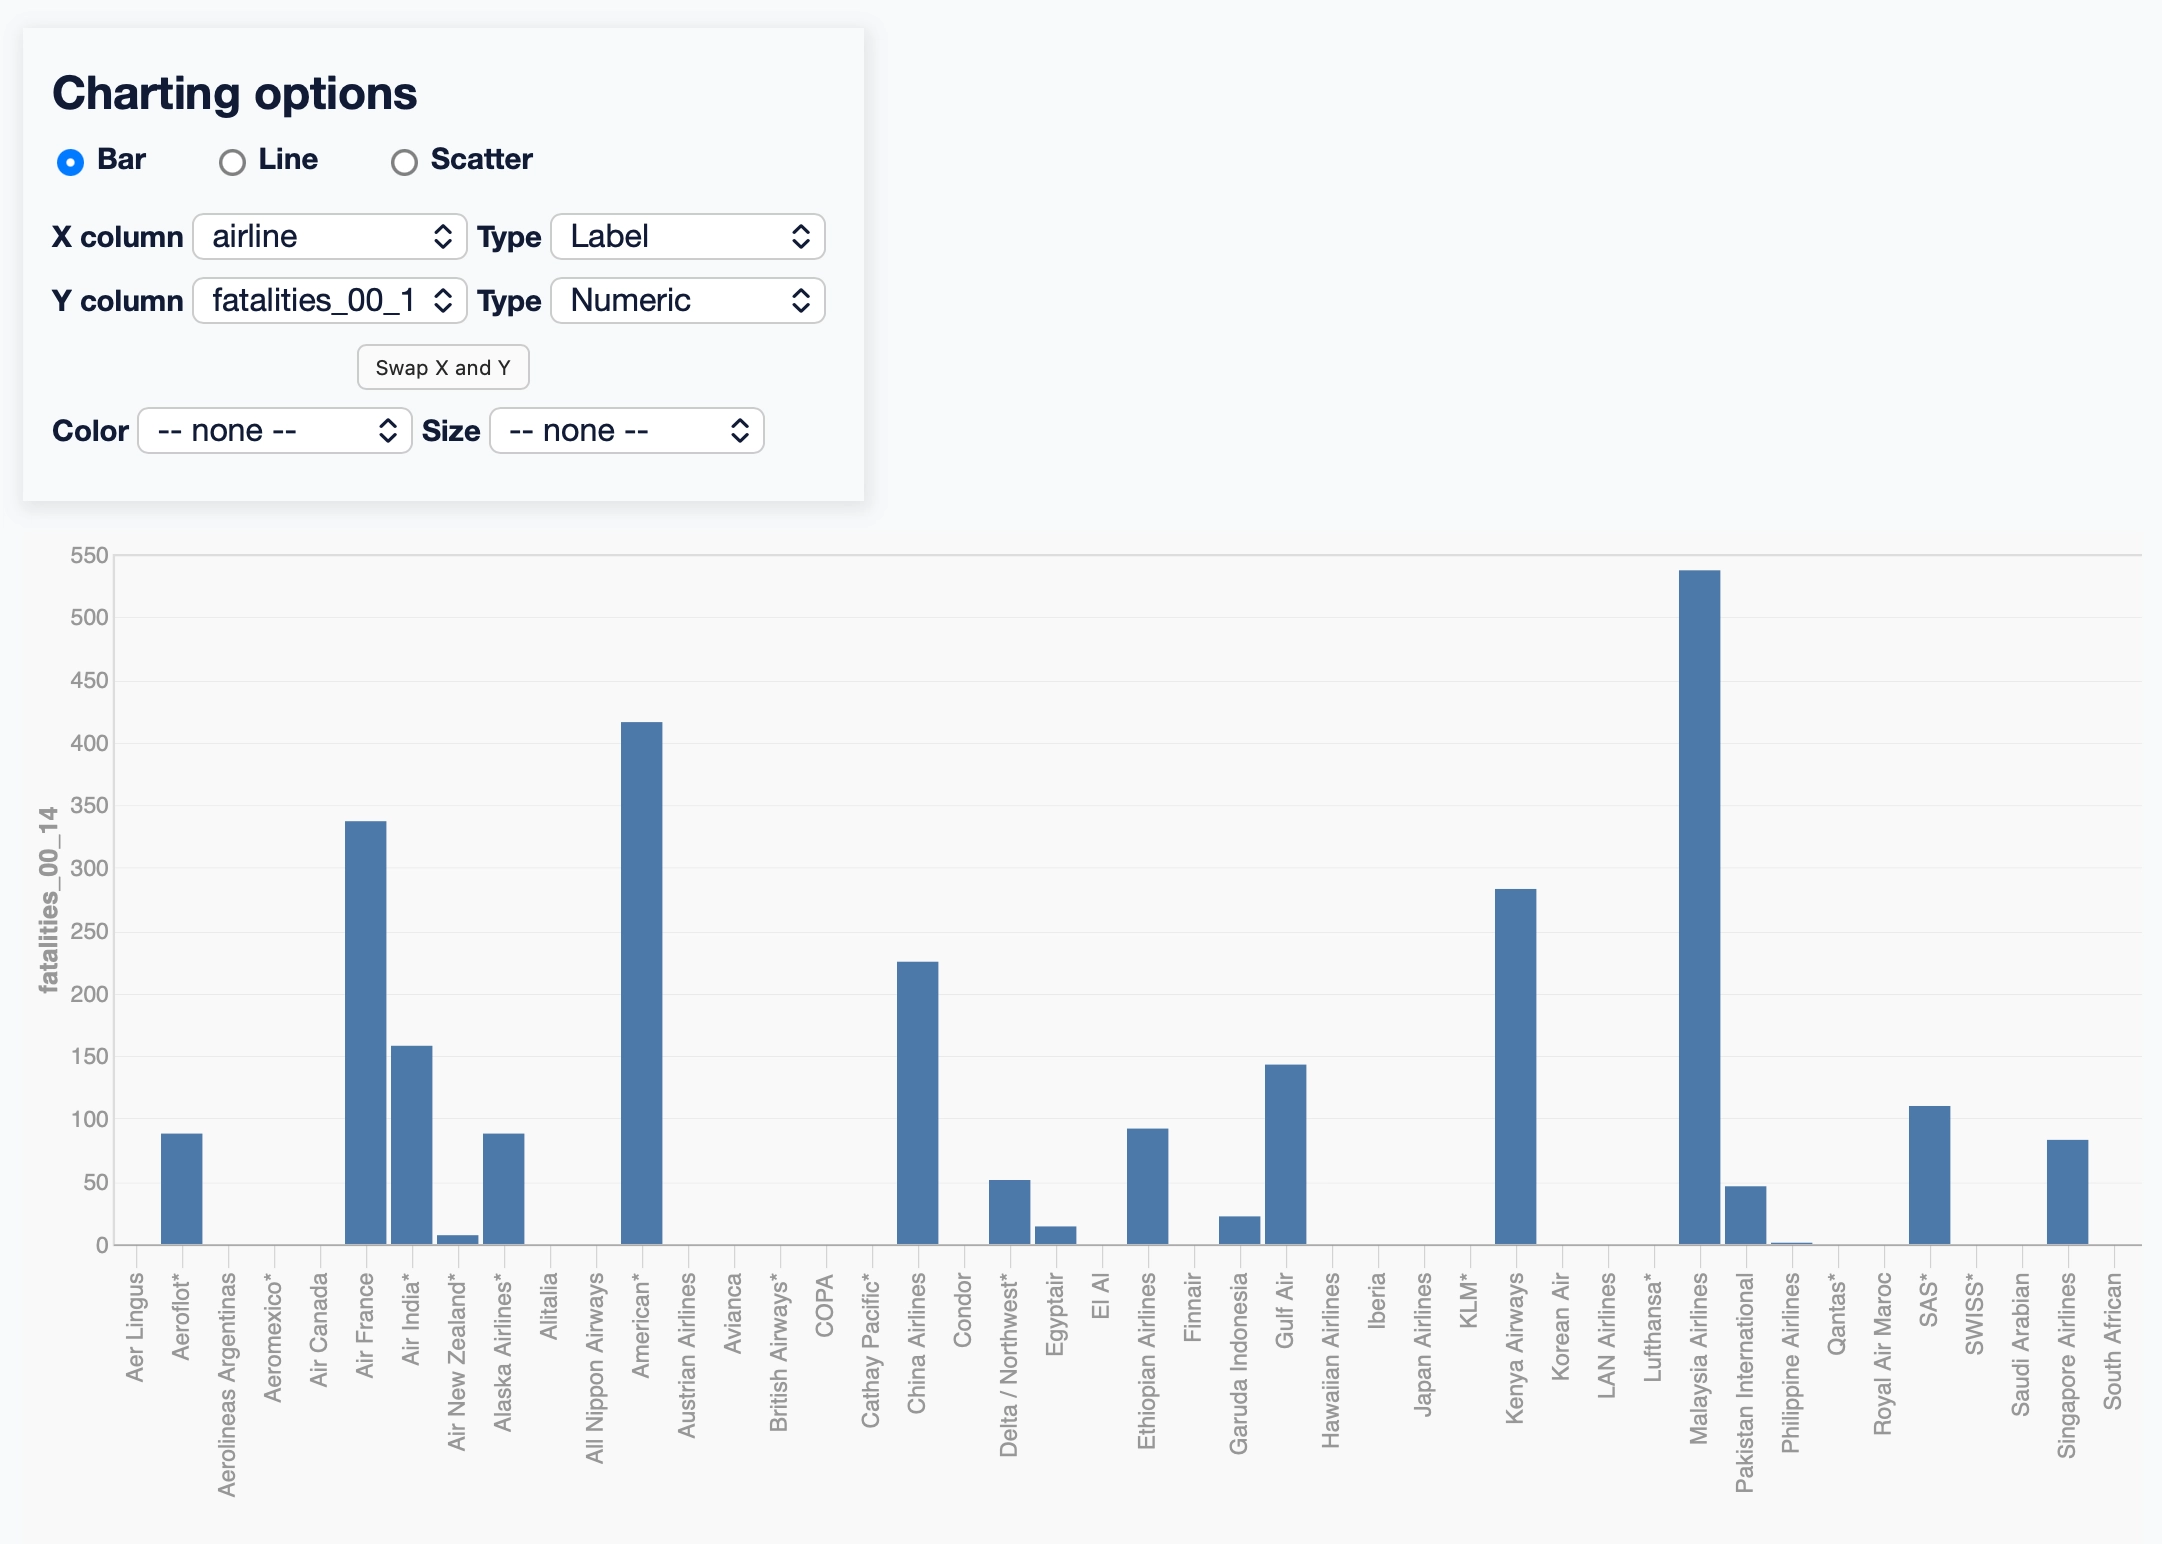
The practical significance of this combination: users don't need to install a local Python environment or start a server—just open a browser, load a CSV, add the plugin, and they can render charts directly. The online demo in the README now links to Datasette Lite, using FiveThirtyEight's airline-safety dataset to showcase the bar chart effect.
Datasette Lite is a browser-side implementation of Datasette that uses Pyodide to compile the Python runtime to WebAssembly and execute it in the browser, so no local environment is needed to load CSV or SQLite files and run a full Datasette application. Early Datasette Lite could only load Python plugins because it runs in a Pyodide environment; JavaScript plugins, however, need to directly manipulate the page DOM, and how to safely load and execute third-party JS plugins when running Datasette in the browser is a new problem. With JS plugin support, the capability boundaries of Datasette Lite expand significantly—pure front-end plugins like datasette-vega can now be used in serverless scenarios.
Charting Capabilities: Sufficient, But Not Fancy
As the screenshot shows, the plugin's interaction panel is quite straightforward: at the top are radio buttons for three chart types—Bar, Line, and Scatter; below are selection menus for the X column and Y column, each with type settings (such as Label, Numeric); further down are a Swap X and Y button and two optional mappings for Color and Size.
In the demo, the X axis is set to airline with type Label; the Y axis is set to fatalities_00_14 with type Numeric. In the resulting blue bar chart, most airlines have no bars, a few have data, and Malaysia Airlines has the tallest bar, with the Y axis scaling to 550.
The design philosophy is "rapid exploration" rather than "publication-grade visualization." Select columns, select types, render—the entire flow doesn't require writing Vega-Lite JSON specs. For scenarios where you need a quick look at data distribution, this is more than enough.
Vega-Lite is a declarative statistical visualization grammar where users describe data mappings in JSON (such as mapping a column to the x axis, a column to the y axis, coloring by a column), and a compiler generates the full Vega specification and renders it as SVG or Canvas. Its advantage lies in expressing common chart types and interactions with concise declarations, without writing drawing code. datasette-vega's role is precisely to convert Datasette query results into Vega-Lite specs and provide a UI layer that lets users select fields via dropdown menus, avoiding hand-written JSON.
The Tool Ecosystem Logic Behind This Update
That a plugin can be picked up again after eight years of inactivity comes down to two practical factors.
The first is the expansion of Datasette Lite's plugin capabilities. Running plugins in the browser breaks the assumption that "plugins must depend on the server," giving a batch of old plugins new use cases. The update to datasette-vega is direct validation of this capability.
The second is the maintainer's trade-off. Rather than taking the opportunity to rewrite the plugin or pile on new features, the author restored compatibility with minimal changes. This kind of restraint is uncommon in open-source maintenance, but it's good for users: low upgrade risk and predictable behavior.
If you've ever used this plugin to chart data in Datasette, 0.7 is worth upgrading to; if you haven't tried it, you can now experience it at zero cost through the online demo on Datasette Lite.
Related articles

Gemini 4 Neon Review: Benchmark Scores Rival Carbon, API Pricing and Quota Breakdown
Google Gemini 4 Neon is now live, benchmark scores closely tracking Carbon, API pricing 3/15 at twice Hydrogen's rate. This article compiles Bilibili creator testing: Neon can replace 90% of Carbon scenarios, AntiGravity quota consumption is only one-third of Carbon, plus subscription channel restrictions and 2API ban risks.

Gemini 4 Helium Coming Soon? Signals of Google Loosening Subscription Restrictions
Google team member hints releases will continue; community speculates Gemini 4 Helium (Flash Lite) may be next. Subscription ban controversy gets a response as product lead says "Soon," suggesting restrictions may be lifted. This article covers Gemini developments, OpenAI Coding Agent and risk management, Doubao real-time audio-video API, and compute business dynamics.

AI-Assisted React Development in Practice: Optimizing a Video App and Handling Errors
A 14-year veteran developer demonstrates AI-assisted React video app optimization: compressing video from 80MB to 5MB (~94%) via ImageKit, plus reliable error handling and retry mechanisms. Includes planning, code understanding, and verification methods for working with AI.