Show HN: An Icon for Every City in North America
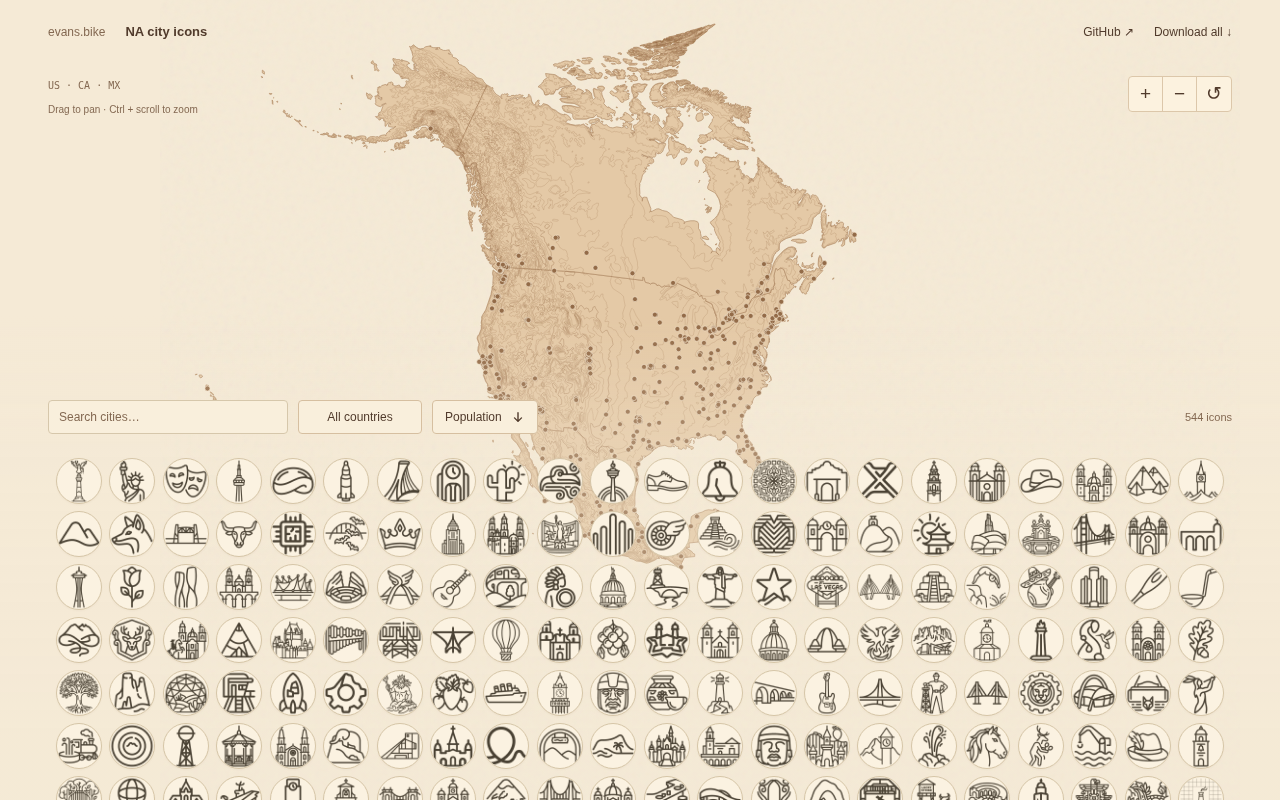
A project concept, technical paths, and design challenges for automatically generating dedicated icons for every city in North America.
The article discusses a project on Hacker News that generates dedicated icons for every city in North America. Since there are tens of thousands of cities in North America, manual design is infeasible. The article outlines three possible technical paths: rule-based procedural generation from structured data, extraction of city form features from open geospatial data such as OpenStreetMap, and generative model-assisted sketch design, analyzing the trade-offs of each in scalability, recognizability, and consistency. The core design contradiction lies in balancing the visual unity of the entire icon set with the individuality of each city, and the article proposes constraining variation within a limited visual grammar framework. Potential applications cover map products, data visualization, travel navigation, and education, while vague city boundary definitions, data maintenance costs, and the choice of open license are the main practical obstacles to implementation.
When Every City Has Its Own Icon, Maps Will Never Look the Same
In the Show HN section of Hacker News, a project called "An icon for every city in North America" has drawn modest attention. Although the post received only 5 points and no comments, its core idea is worth exploring: designing or generating a unique visual icon for every city on the North American continent. This sounds like a design experiment, and it may also point to the prototype of an automated city identifier generation system.
Project Background: Why Cities Need Dedicated Icons
On traditional maps, cities are usually represented as dots or text labels, offering extremely limited visual information. The value of city icons lies in their ability to compress abstract information such as geographic location, cultural symbols, and landmark buildings into a recognizable graphic. For data visualization, travel applications, and map products, such an icon system can significantly improve information density and user intuition.
The challenge of "making an icon for every city" lies not in the design itself, but in scale—North America has tens of thousands of cities, towns, and settlements. Manual design is clearly infeasible, so the project most likely relies on some automated or semi-automated generation process.
Possible Technical Implementations
Based on common forms of Show HN projects, such "city icon libraries" generally have three implementation paths:
1. Rule-Based Procedural Generation
Starting from structured data such as city names, coordinates, population, and elevation, algorithms map them to shapes, colors, and line styles. For example, coastal cities might receive wave elements, while inland cities use mountain or plain patterns. This approach is fully scalable, but the differentiation between icons may be limited.
2. Extracting Features from Open Geospatial Data
Using open data such as OpenStreetMap, the system automatically identifies city boundaries, road grids, and river courses, then simplifies these geometric features into icon graphics. Icons generated this way are strongly correlated with the actual form of the city and are more recognizable, but the computational and cleaning costs are also higher.
OpenStreetMap (OSM) is an open geographic database collaboratively built by volunteers worldwide, published under the Open Database License (ODbL), which allows free use, modification, and distribution. Its data covers road networks, building outlines, water systems, administrative boundaries, land use, and other elements, often down to the block level. For city icon generation, the value of OSM lies in directly extracting the road grid topology, river courses, and coastline shapes of a city, then transforming them into graphic language through simplification, abstraction, and stylization. However, OSM data quality varies greatly across regions, and the completeness of city boundary tags (boundary=administrative) is inconsistent, so extensive cleaning and normalization work is usually required before actual use.
3. Generative Model-Assisted Design
Using generative models to produce icon sketches based on landmark images, city photos, or text descriptions, followed by manual selection or fine-tuning. This approach can yield more artistic icons, but consistency and controllability are challenges.
The project did not disclose specific technical details in the post, but judging from the phrase "each city," automated generation is almost certainly the choice.
Generative models refer to a class of machine learning models that produce new content by learning data distributions, commonly including diffusion models (such as Stable Diffusion) and generative adversarial networks (GANs). In icon design scenarios, they can generate sketches based on text prompts or reference images, greatly reducing the cost of starting from scratch. However, such models have two inherent shortcomings: first, output consistency is difficult to guarantee, and results from the same prompt can vary greatly across generations, making it hard to maintain a unified style across an entire icon system; second, controllability is limited, and precisely specifying line thickness, color schemes, or composition grids requires additional conditional control methods (such as ControlNet, LoRA fine-tuning, etc.). Therefore, in practical engineering, generative models usually handle creative exploration and sketch-stage work, while final products still require manual selection or rule-based post-processing.
Balancing Design Consistency and City Individuality
An icon system covering an entire continent faces a fundamental contradiction: if all icons are highly unified in style, differences between cities are weakened; if every city is free to express itself, the entire system loses visual order.
A better approach is to establish a limited visual grammar—a fixed palette, line thickness, corner radius, and composition grid—and then let city characteristics vary within this framework. This ensures that the icons look like a system when placed together, while allowing each city to retain recognizability.
This is also a classic proposition in the field of city branding. In reality, many cities already have official logos, but they are intended for municipal publicity rather than small icons for maps and interfaces. The two are completely different in information density and use cases.
Visual grammar borrows a linguistic metaphor to refer to a set of composable, reusable visual rules, including color systems, shape vocabulary, line specifications, spacing, and grid systems. In icon systems or design systems, visual grammar functions like grammatical rules: it does not prescribe what each specific sentence looks like, but defines how sentences can be constructed. For an icon library covering tens of thousands of cities, establishing visual grammar means making explicit "what can change and what cannot"—for example, allowing city characteristics to determine graphic motifs, while locking the palette, corner radius, and line width to unified specifications. This ensures controllable output during batch generation and gives subsequent new cities a rule to follow, avoiding style drift.
Potential Application Scenarios
If this icon library can be continuously maintained, its uses go beyond map labeling:
- Travel and Navigation Apps: Use icons instead of text in map thumbnails and itinerary cards to improve browsing efficiency.
- Data Visualization: Use icons to strengthen regional recognition in thematic maps on population, economy, climate, and other topics.
- Education and Popular Science: Help users quickly build an intuitive impression of the distribution and characteristics of North American cities.
- Games and Interactive Content: Serve as visual assets for gameplay such as level selection and city collection.
Challenges Worth Noting
Whether such a project can truly be realized depends on several practical issues. First is the completeness of data coverage: the definition of North American cities itself is disputed, and the boundaries between legally incorporated cities, census-designated places, and unincorporated communities are blurred. Second is update and maintenance: cities change, and an icon system that cannot iterate will become outdated. Finally, there is copyright and open licensing: the license under which the icon library is released directly affects whether it can be widely adopted.
The project currently has limited information, but it touches on a valuable direction—transforming geographic information into reusable visual assets. For teams working on map products, data visualization, or design systems, this idea is worth continued attention.
Open licensing is the key legal foundation that determines whether an icon library can be widely reused. Common open content licenses include MIT, CC BY 4.0, CC BY-SA 4.0, and CC0: MIT is mostly used for code; CC BY requires attribution; CC BY-SA requires derivative works to use the same license and is "viral"; CC0 waives all rights and is the most convenient for commercial use. If the icon library is generated based on OSM data, note that ODbL's derivative database clauses may impose requirements on how results are distributed. The choice of license directly affects whether commercial products can integrate without friction, and also affects community contributors' willingness to participate, making it a decision that should be clarified early in project design.
One-line Summary
A project concept, technical paths, and design challenges for automatically generating dedicated icons for every city in North America.
Paragraph Summary
The article discusses a project on Hacker News that generates dedicated icons for every city in North America. Since there are tens of thousands of cities in North America, manual design is infeasible. The article outlines three possible technical paths: rule-based procedural generation from structured data, extraction of city form features from open geospatial data such as OpenStreetMap, and generative model-assisted sketch design, analyzing the trade-offs of each in scalability, recognizability, and consistency. The core design contradiction lies in balancing the visual unity of the entire icon set with the individuality of each city, and the article proposes constraining variation within a limited visual grammar framework. Potential applications cover map products, data visualization, travel navigation, and education, while vague city boundary definitions, data maintenance costs, and the choice of open license are the main practical obstacles to implementation.
Related articles

M&M's Spent Millions Replacing Artificial Blue Dye — Why Is It So Hard?
Mars spent millions trying to replace artificial blue dye in M&M's with spirulina, but thick material clogs pipes and residue risks mold, forcing a full production-line rebuild. Here's the engineering behind the reformulation.

Teammate Wanted for Meta Global AI Developer Hackathon: Computer Vision & Medical AI
A Reddit developer seeks teammates for the Meta Global AI Developer Hackathon, focusing on computer vision and medical AI. This article analyzes the track logic, skills-complementarity needs, and topic selection strategy behind this teaming signal.
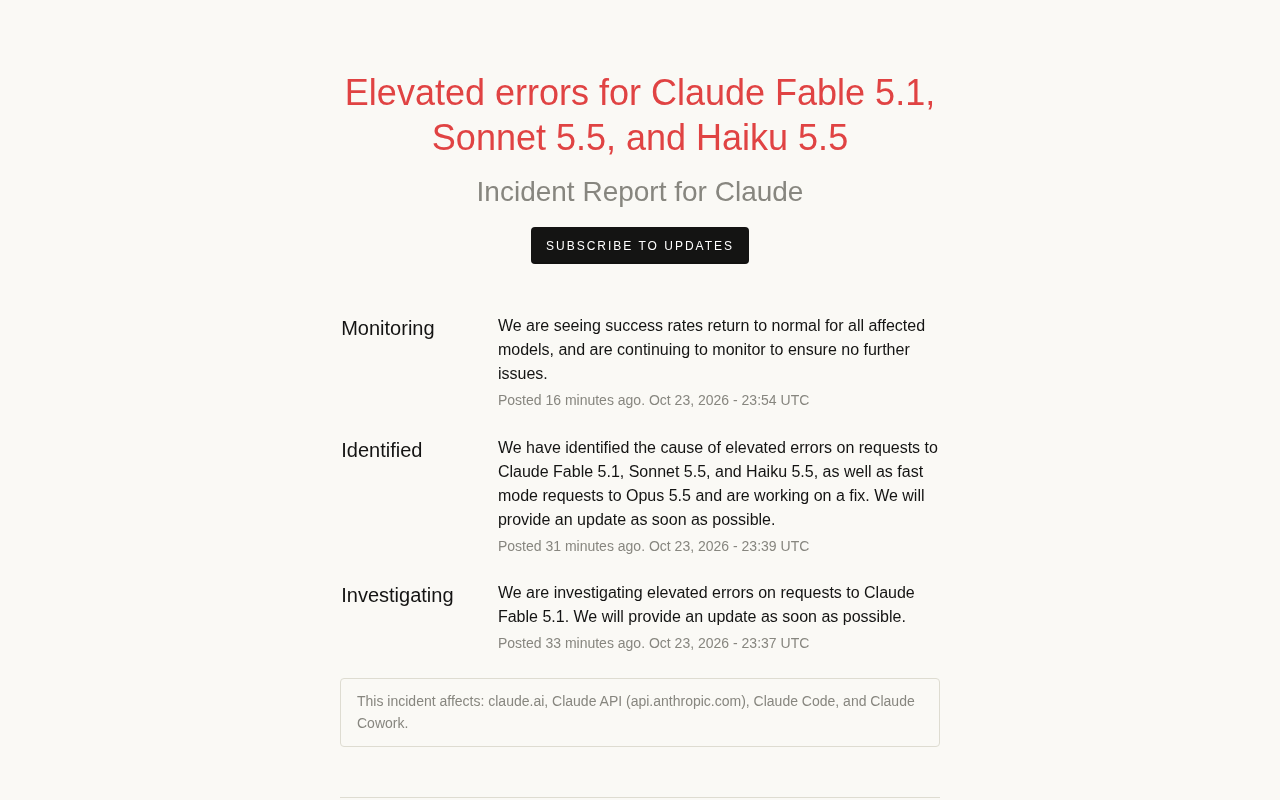
Multiple Claude Models Hit by Errors: A Postmortem of Fable 5.1, Sonnet 5.5, and Haiku 5.5
Claude Fable 5.1, Sonnet 5.5, Haiku 5.5, and Opus 5.5 fast mode saw elevated errors; Anthropic identified and resolved the issue in 17 minutes. This postmortem covers the timeline, the technical reasons for the multi-model cascading failure, and practical lessons for retry and degradation strategies.