Show HN Hit: Look Up Satellites Over Any Location and See Their Real Imagery

A weekend project computes 17,000 satellite overpasses in real time in the browser and shows actual overpass imagery.
This is a weekend "slacking off" project by a satellite enthusiast that hit 300 points on Hacker News. Enter any location, and the tool looks back at every satellite that passed overhead in the past 7 days and pulls up real remote sensing imagery those satellites captured at overpass. Technically, it uses SGP4 orbit propagation with the CelesTrak catalog to compute orbits for 17,000+ targets in about half a second in the browser; all on-orbit objects are drawn by the GPU with Kepler's equation solved every frame for real-time rendering; and it corrects the 5–10 minute offset between Sentinel-2 image timestamps and actual overpass times. The tool promises not to store user location data, and the code is open-sourced on GitHub. The author sees its value in bridging public orbit data and public remote sensing archives.
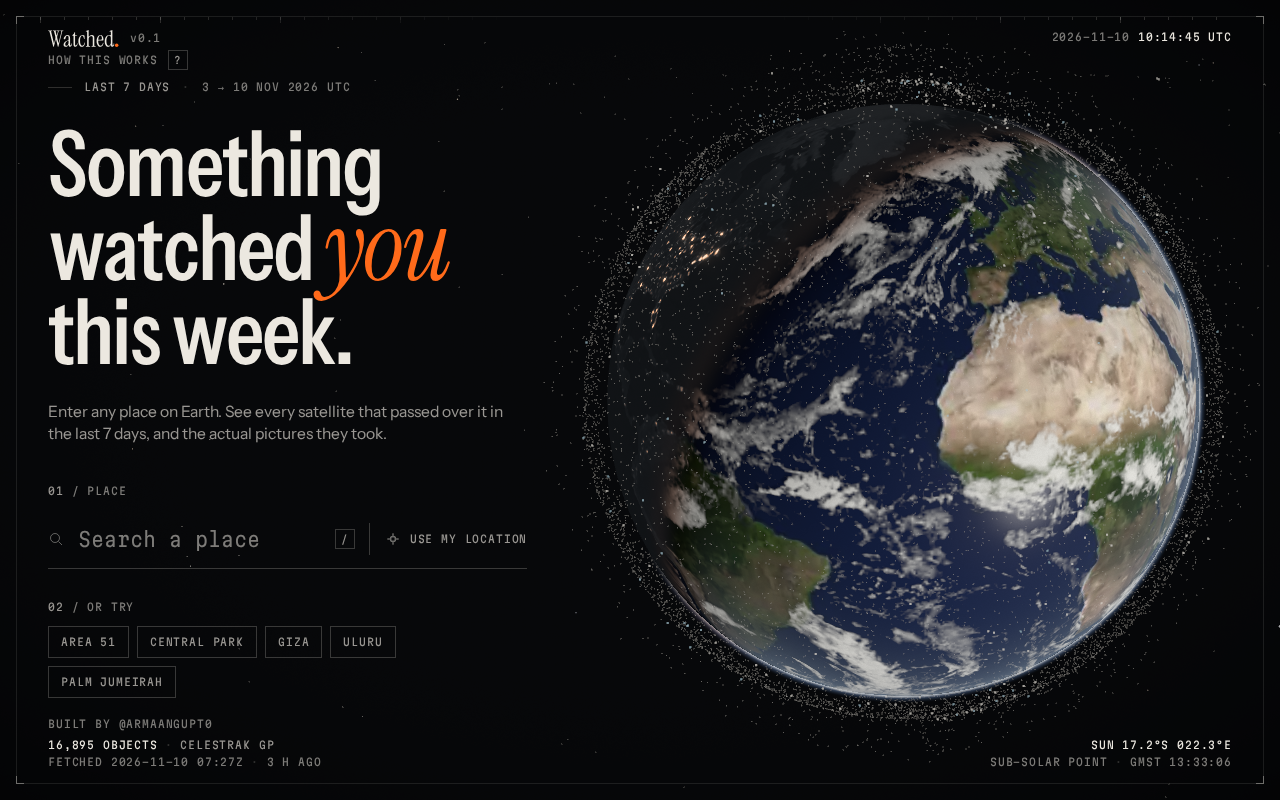
A weekend "slacking off" project just hit 300 points on Hacker News. The author, a self-described "satellite geek," got bored one weekend and built something: enter any location on Earth, and the system finds every satellite that passed over that spot in the past 7 days—and pulls up the actual photos those satellites took during those overpasses.
The launch post drew 50 comments, with discussion centering on two themes—how hardcore the engineering is, and what else this kind of "geospatial visualization" tool could do.
What This Tool Actually Does
Enter a Location, Look Back 7 Days of Satellite Overpasses
The interaction is dead simple: type in any location, and the tool looks back over the past 7 days to list every satellite that passed overhead. Under the hood it uses the SGP4 orbit propagation algorithm with the CelesTrak catalog, tracking over 17,000 satellites—and it all runs in the browser in about half a second.
That response time is worth a closer look. Orbit calculations for 17,000 moving targets would traditionally either be queued on a backend or served from precomputed caches. The author crammed it into the browser, meaning there's virtually no perceptible wait between hitting Enter and seeing results.
SGP4 and TLE: SGP4 (Simplified General Perturbations model 4) is the classic orbit propagation model developed by NORAD for near-Earth orbital objects, and it's the companion algorithm to TLE (Two-Line Element set), the standard orbit data format provided by CelesTrak. TLE describes a satellite's state at a given epoch using mean orbital elements, and SGP4 extrapolates those elements—along with perturbation terms like Earth's non-spherical gravity and atmospheric drag—to compute position and velocity at any given time. Its computational load is small and its accuracy is sufficient for visualization, which is why it's widely adopted in satellite tracking tools. Note that TLE itself is public data with limited precision (near-Earth orbit errors can reach the kilometer level), so these tools are suited for "seeing overpasses" rather than precision orbit determination.
Photos Come from the Actual Overpass Moment
The images shown aren't illustrations or renders. The tool pulls real imagery from Sentinel-2, Landsat, and NASA—the actual frames captured by those satellites as they flew over. The author specifically emphasizes in the post that only real photos from "those specific satellites" are shown, with no substitutions or composites.
This defines the tool's usability boundary. It's not a "give you a rough idea" toy—it reconciles satellite orbit data against public remote sensing archives.
Two Hardcore Technical Details
GPU Solves Kepler's Equation Frame by Frame
The first implementation detail the author mentions: all ~17,000 objects in orbit are drawn by the GPU, and Kepler's equation is solved every single frame.
The weight of that statement is in "every single frame." If satellite orbit visualization merely interpolated ephemeris tables into animations, the computational load wouldn't be much; but solving Kepler's equation for every object every frame is genuine physics computation. Only by parallelizing it on the GPU does this scale sustain real-time rendering. For readers working in WebGL or graphics development, this is the most copy-worthy part of the post.
Kepler's equation: In the two-body problem, a satellite moves along an elliptical orbit, and the eccentric anomaly E and mean anomaly M satisfy M = E − e·sin E (where e is eccentricity)—this is Kepler's equation. Given the M corresponding to a time, you need to invert it to find E, then convert to true anomaly to get the satellite's position on its orbit. This equation has no analytical solution and can only be solved iteratively (e.g., Newton's method). Iterating for 17,000 objects every frame is a substantial computational load, and the GPU's parallel architecture happens to suit this kind of workload—"the same iterative logic applied to a large number of independent objects"—which can be batched via shaders or WebGPU general-purpose computing.
Correcting the 5–10 Minute Time Offset
The second detail is subtler and more consequential for correctness. Sentinel-2 image timestamps often differ by 5 to 10 minutes from the moment the satellite actually crosses your location. Without handling this offset, the "overpass imagery" users see would be spatially misaligned.
The author says some "cool math" was done to ensure accurate results on the site. The post doesn't elaborate on the method, but judging from the nature of the problem, it involves timestamp alignment and ground track matching—the kind of step where laypeople see no issue but experts immediately know you can't fake it.
Sentinel-2 timestamps and observation mode: Sentinel-2 is a multispectral imaging satellite under ESA's Copernicus program, operating as a twin constellation with a single-satellite revisit period of about 10 days and a combined revisit of about 5 days. Its image metadata time is usually marked as the imaging moment, but a full scene is acquired in push-broom fashion, and combined with product generation and metadata recording methods, the "product timestamp" doesn't coincide with the moment the satellite is directly above a ground point. To do point-level matching like "which image was taken over your house," you must align the image's acquisition geometry (scene center, imaging time) with the orbital sub-satellite track—this is the core difficulty of the correction.
Privacy and Open Source
The tool does not store user location information—a commitment the author explicitly makes. For an application that requires entering a geographic location, this promise is essential, especially given that the browser already handles a substantial amount of computation.
The code is publicly available on GitHub (repository name: satellites), and the author directly invites feedback and contributions in the post. The combination of 300 points and 50 comments is a strongly positive signal for a weekend project—the HN community never hesitates to upvote projects that "take public data and do something clever with it yourself."
What Makes This Kind of Tool Valuable
From a product perspective, it fills a long-neglected gap: satellite orbit data (CelesTrak) and remote sensing image archives (Sentinel, Landsat, NASA) are both public, but there's no bridge between them. An ordinary user who wants to know "what flew over my house last Wednesday afternoon and what did it photograph" previously needed to understand both orbital mechanics and remote sensing data retrieval. Now they just need an input box.
For developers, the project's reference value lies in the boldness of its technical choices. Compressing orbit calculations into the browser isn't a necessity—you could take the lazy route and put it on a server—but the author chose the harder path and got a half-second interaction experience in return. This "push computation as close to the user as possible" philosophy often produces qualitative leaps in data visualization tools.
As for where it could go next: historical imagery timeline lookback, subscription alerts for specific satellites, multi-location batch queries—all are natural extensions suggested in the comments. The author's attitude at the end of the post is open: "Feedback, contributions, or anything you can offer are welcome."
One-line Summary
A weekend project computes 17,000 satellite overpasses in real time in the browser and pulls up actual overpass imagery.
Paragraph Summary
This is a "slacking off" weekend project by a satellite enthusiast that hit 300 points on Hacker News. After a user enters any location, the tool looks back at every satellite that passed overhead in the past 7 days and pulls up the real remote sensing imagery those satellites captured at the moment of overpass. Technically, the tool uses the SGP4 orbit propagation algorithm with the CelesTrak catalog to compute orbits for 17,000+ targets in about half a second in the browser; all on-orbit objects are drawn by the GPU with Kepler's equation solved every frame for real-time rendering; and it specifically corrects the 5–10 minute offset between Sentinel-2 image timestamps and actual overpass times. The tool promises not to store user location data, and the code is open-sourced on GitHub. The author sees its value in filling the gap between public orbit data and public remote sensing archives.
Related articles
FBI-Warned AI Hacking Tool ARTEX: Cost Disruption and Defensive Restructuring
The FBI-warned AI hacking tool ARTEX reduces penetration testing costs to $150-$1,500, causing financial data breaches and supply chain attacks. Learn how it works, real cases, and a five-step defense strategy.
FBI Warns: ARTEX AI Hacking Tool Breaches Systems in Three Hours
FBI warns the open-source AI pentesting framework ARTEX is being abused, with some intrusions gaining privileged access in under three hours, over 1,600 consoles exposed, and links to South Korean financial data breaches and the ConnectWise supply chain attack.
FBI Warns About Artex: AI-Driven Attack Framework Threatens Cloud Identity Security
FBI warns that the AI penetration testing framework Artex is being used for automated attacks: written in Go and driven by AI agents, it covers the full chain from reconnaissance to data exfiltration. This article analyzes its real threat to cloud identity and privilege security and key defense priorities.