The Hidden Challenge of LLM Inference Cost Tracking: Why Your Bill Never Tells the Full Story
LLM production cost management is really an attribution problem, not a calculation problem.
The article examines a widespread pain point for LLM teams in production: provider bills show aggregated spend but can't explain how retries, model fallbacks, and multi-step agent calls each consume budget. Three coping strategies exist — provider dashboards (too coarse), LLM observability tools (require integration), and custom instrumentation (flexible but costly to maintain) — each with clear trade-offs. The core argument is that as agent applications grow in complexity, fine-grained workload-level cost attribution will shift from optional to a baseline MLOps requirement, yet the tooling ecosystem still lacks a clear standard.
The LLM Cost Black Hole in Production
Once LLM workloads hit production, a problem that's easy to overlook during development quickly becomes impossible to ignore: your provider's bill tells you how much you spent, but rarely explains why you spent it.
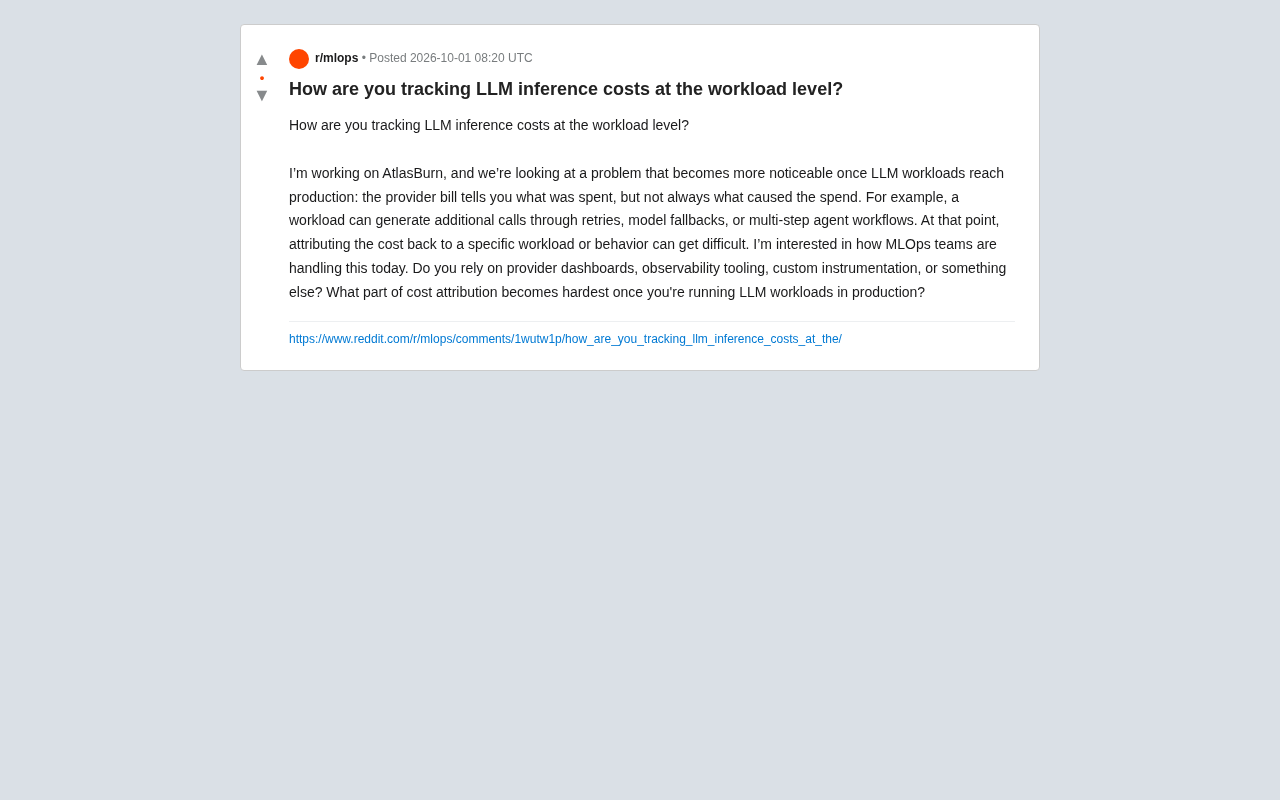
This is the core pain point highlighted in a discussion from the AtlasBurn team on Reddit. The original poster noted that a single workload can generate a significant number of additional API calls due to retries, model fallbacks, or multi-step agent workflows. When these behaviors compound, accurately attributing costs to a specific workload or behavior pattern becomes extremely difficult.
For teams scaling LLM deployments, this isn't an edge case — it's a real challenge that directly impacts cost control and architectural decision-making.
Why There's a Gap Between the Bill and the Cause
Traditional cloud cost attribution is relatively straightforward: how long an instance ran, how many resources it consumed — the bill makes it clear. But LLM inference has a fundamentally different cost structure.
The Opacity of the Call Chain
LLM applications rarely map one user request to one API call. A single user query might trigger:
- Retries: When a model returns a timeout or error, the request is automatically resent — and every retry burns real tokens and real money.
- Model fallbacks: When the primary model is unavailable or underperforms, the system switches to a backup model that may be priced completely differently.
- Multi-step agent workflows: A single agent task might internally call the model a dozen times across planning, tool use, reflection, and summarization steps.
These behaviors create a disconnect between "one business request" and "the actual inference cost incurred." Your bill shows aggregated token counts and total spend, but offers no way to trace back which workload or behavior pattern consumed the budget.
The cost amplification effect of multi-step agent workflows deserves particular attention. Take the ReAct (Reasoning + Acting) pattern as an example: an agent completing a task alternates through "think–act–observe" cycles, each generating an independent model call. On top of that, modern agent frameworks like LangChain and AutoGen typically inject the full conversation history at every step, causing token consumption to grow roughly linearly — or even quadratically — with each iteration. A seemingly simple task might involve dozens of internal calls, with per-request inference costs exceeding 10x that of a naive single-turn Q&A. This "call explosion" is easy to miss during development when request volume is low, but once you hit production with real concurrency, the cost curve rises at a pace that catches teams off guard.
Missing Dimensions in Cost Attribution
Provider billing typically operates at the API key or project level. The dimensions teams actually need — per workload, per user segment, per feature module, per agent step — represent business-semantic attribution that almost no off-the-shelf tooling directly supports.
From an engineering standpoint, the most common way to bridge this attribution gap is through metadata tagging — passing custom labels via request headers or metadata fields. The OpenAI API, for instance, supports a user field as a basic identifier, but lacks richer structured tagging capabilities. A more complete approach is to maintain a "call context" object at the application layer, injecting workload name, feature module, and trigger reason before each model call, then writing everything to a data warehouse or observability backend. This is conceptually similar to "Baggage Propagation" in distributed systems — carrying business-semantic context along the entire call chain so any downstream record can be traced back to its business origin. Without this mechanism, even a complete call log leaves you relying on fuzzy time-window alignment for post-hoc attribution, with substantial error.
How Teams Are Coping Today
The original poster posed an open question: how are MLOps teams actually handling cost tracking right now? A few broad approaches exist in the industry, each with trade-offs.
Relying on Provider Dashboards
The path of least resistance is to use the usage dashboards provided by OpenAI, Anthropic, and similar providers. The upside: zero integration cost. The downside: coarse granularity, high latency, and virtually no ability to break costs down by business dimension. This may be sufficient for small teams running a single application, but it completely falls apart when multiple workloads are running side by side.
Observability Tools
Some teams are adopting dedicated LLM observability platforms, instrumenting the request path to record the model, token count, latency, and cost for every call. These tools can capture retry and fallback behavior, but typically require additional integration work — and their ability to model multi-step agent workflows varies significantly across products.
Several LLM-specific observability products are already on the market, including LangSmith (LangChain's official offering), Helicone, Langfuse, and Arize Phoenix. The core mechanism these tools use is proxy interception at the LLM client SDK or HTTP layer, automatically capturing prompt, completion, token usage, latency, and cost for every call and associating it with a complete trace. Compared to traditional APM tools, the differentiating capability of LLM observability platforms lies in understanding the semantic relationships between spans — for example, distinguishing which calls belong to planning steps versus tool-call result processing. That said, support for self-hosted models or non-mainstream inference endpoints varies widely, so you'll need to evaluate any tool against your specific model provider ecosystem.
Custom Instrumentation
Teams with stronger engineering capacity often build their own instrumentation, manually logging context labels for each model call in code — such as workload name, call reason, and triggering chain. This approach offers the highest flexibility and the most precise attribution, but maintenance costs are non-trivial, and it's easy for instrumentation to fall out of sync as the codebase evolves.
Where the Real Difficulty Lies
This discussion surfaces a key insight: the hard problem of LLM cost management isn't calculating spend — it's attributing it.
Calculating total spend is easy; your provider already does it for you. The genuinely hard questions are: Which feature caused this cost spike? Did some agent get stuck in a pointless loop, calling the model over and over? Is the model fallback strategy quietly inflating costs? Is the retry threshold set sensibly?
Without fine-grained attribution, optimization has no starting point — you don't even know where to look when you need to cut costs.
This explains why projects like AtlasBurn are focused specifically on workload-level cost tracking. As more applications evolve from simple single-turn Q&A toward complex agent orchestration, the expansion of call chains will make cost attribution an increasingly acute problem.
Implications for MLOps Practice
For teams moving LLMs toward production — or already there — this discussion is worth taking seriously:
- Build cost observability early, rather than scrambling to retrofit instrumentation after a bill shock.
- Use business semantics as attribution dimensions, not just technical API call counts.
- Pay special attention to agent and retry logic — these are the highest-risk areas for runaway costs.
- Weigh flexibility against maintenance burden when choosing between off-the-shelf observability tools and building your own.
This is still an evolving space with no unified best practices. But one thing is clear: as LLM applications grow in complexity, being able to see exactly where the money goes will shift from a nice-to-have to a baseline requirement for production-grade MLOps.
Related articles

Build an AI Super Employee System at Zero Cost: A Full Breakdown of Automated Agent Workflows
A deep breakdown of the AI super employee system demoed on Bilibili: agent orchestration, digital human voiceovers, map and enterprise lead generation, 24/7 customer service, and legal modules. We analyze the business logic and compliance risks behind zero-cost signup to help entrepreneurs judge the real ROI of this AI digital employee system.

The Essential Difference Between Chatbots and AI Agents: Crossing from Conversation to Execution
What's the difference between a chatbot and an AI agent? Based on the MCP series on the Learn Tech channel, this article uses examples like booking flights and summarizing notes to explain: a chatbot only gives answers, while an agent actually completes tasks through a think-act-observe loop. It breaks down the four core components—model, tools, memory, and goal—as well as MCP's role as a bridge, and discusses agents' applicable boundaries and permission risks.

Free GitHub Repo: 342 Hours of AI Courses, from Math to MCP Servers
A free GitHub repo offers 342 hours of AI courses: 523 lessons across 20 phases, from math fundamentals to agent building and MCP servers. Nearly 100,000 learners have started.