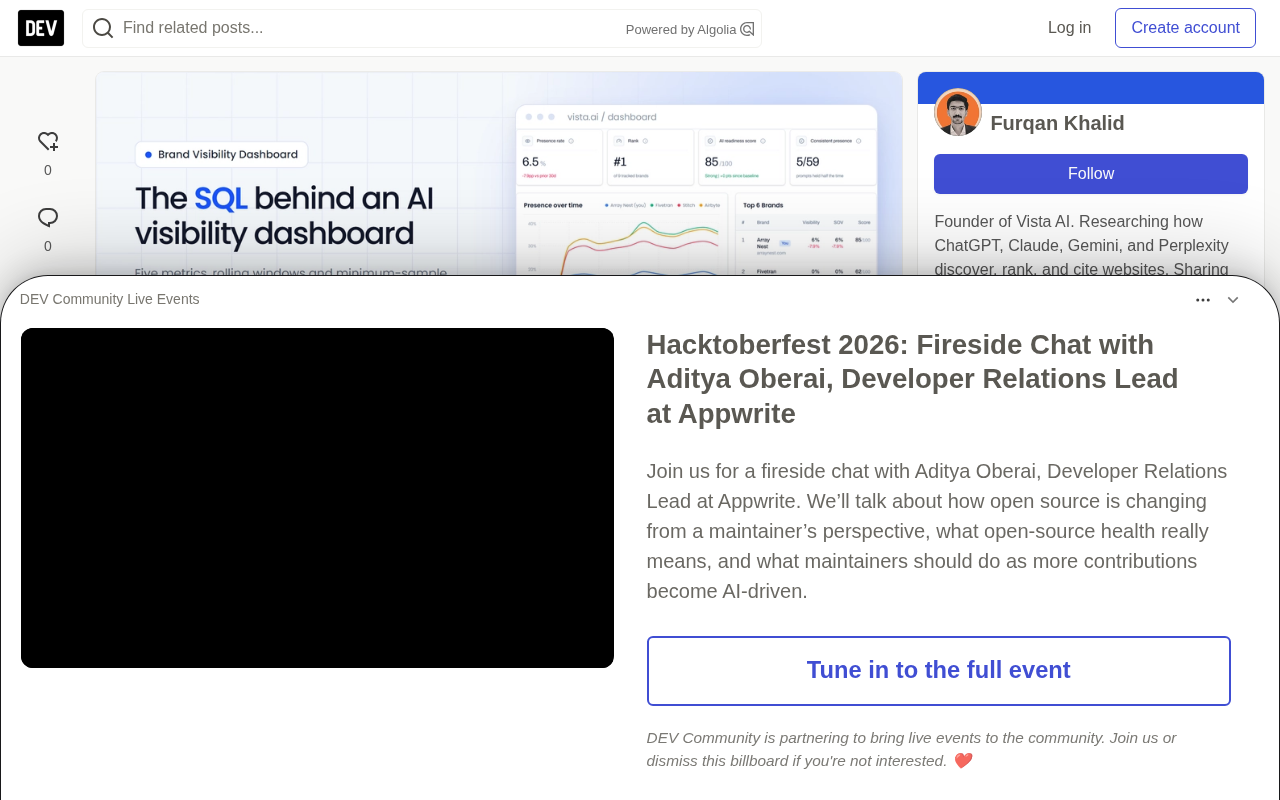
The SQL Behind an AI Visibility Dashboard: Five Metrics and Their Traps

Five core SQL metrics for building an AI visibility dashboard, plus their data traps and safeguards.
The article presents five core SQL-based metrics for an AI brand visibility dashboard: 7-day rolling visibility, share of voice, average position when listed, the citation-vs-mention gap, and sentiment composition. Each metric includes SQL code and specific trap warnings—such as averaging daily percentages distorting small-sample days, rolling windows assuming one row per day, share of voice shifting with brand set changes, average position moving inversely to visibility, and net sentiment scores masking neutral-to-critical shifts. It stresses that every ratio must carry its denominator, and offers safeguards like pinning the scorer version via a base view, annotating brand set changes, and setting minimum sample size thresholds, so the dashboard holds up in meetings. It closes with a recommended layout and guidance on build vs. buy.
After collecting LLM answers every day and scoring brand mentions in them, someone will always come asking for a dashboard. That's also the moment when a pile of good data can easily turn into misleading charts.
The traps in this kind of data are unusual: answers are non-deterministic, sample sizes per prompt are tiny, different engines vary wildly, and the competitor set keeps shifting. The original article uses SQL (SQLite dialect, easy to migrate) to write out five metrics worth putting on a dashboard, along with the safeguards that keep each one honest.
The data structure follows earlier posts in this series: prompt, brand, run (a single API call), and score (one row per run × brand).
Start with a base view
Every metric starts from the same join. Put it in a view so dashboards don't drift apart:
CREATE VIEW v_scored AS
SELECT r.run_date,
       r.engine,
       r.prompt_id,
       p.intent_stage,
       p.topic,
       b.name   AS brand,
       b.is_ours,
       s.mentioned,
       s.position,
       s.cited,
       s.sentiment
FROM run r
JOIN prompt p ON p.id = r.prompt_id AND p.active = 1
JOIN score  s ON s.run_id = r.id AND s.scorer_version = 'v2'
JOIN brand  b ON b.id = s.brand_id;
Pinning scorer_version in one place means a scorer upgrade is a one-line change, rather than hunting through twenty chart queries.
Metric one: Visibility and rolling windows
Visibility is the share of answers that mention you. Daily values swing wildly because there are only a handful of samples per prompt per day, so plot a 7-day rolling rate and show daily points faintly behind it.
WITH daily AS (
  SELECT run_date, engine,
         SUM(mentioned) AS k,
         COUNT(*)       AS n
  FROM v_scored
  WHERE is_ours = 1
  GROUP BY run_date, engine
)
SELECT run_date, engine, n,
       1.0 * SUM(k) OVER w / SUM(n) OVER w AS visibility_7d
FROM daily
WINDOW w AS (PARTITION BY engine ORDER BY run_date
             ROWS BETWEEN 6 PRECEDING AND CURRENT ROW)
ORDER BY engine, run_date;
Trap: Averaging daily percentages (AVG(k*1.0/n)) gives a 4-sample day the same weight as a 40-sample day. Instead, sum the numerator and denominator separately within the window, as above.
Trap: ROWS BETWEEN 6 PRECEDING assumes one row per day. If the collector skips a day, the window silently stretches to 8 days. If missing dates matter, join to a calendar table first.
Why use a window function instead of a simple aggregate? A window function is a special SQL function that computes a value over a set of related rows without collapsing the result set. Unlike GROUP BY, which merges multiple rows into one, a window function preserves every row's detail while attaching aggregated values, so you can see both daily raw data and the 7-day rolling result on top of it. ROWS BETWEEN 6 PRECEDING AND CURRENT ROW defines a "sliding frame," meaning each output row references the current row plus the previous 6 rows. PARTITION BY engine first partitions by engine, ensuring rolling windows for different engines don't interfere with each other. This mechanism is the key to "smoothing without losing detail" in dashboards, and it's the correct solution to avoiding the classic trap of averaging daily percentages.
Metric two: Share of voice
Share of voice is your proportion of all brand mentions, computed per engine. The denominator is mentions of tracked brands, so it only makes sense when the competitor set is fixed.
SELECT engine,
       brand,
       SUM(mentioned) AS mentions,
       ROUND(1.0 * SUM(mentioned) /
             SUM(SUM(mentioned)) OVER (PARTITION BY engine), 3) AS sov
FROM v_scored
WHERE run_date >= date('now', '-28 days')
GROUP BY engine, brand
ORDER BY engine, sov DESC;
SUM(SUM(...)) OVER (...) opens a window on the grouped result: total mentions per engine, computed after GROUP BY.
Trap: Adding a competitor mid-period drags down everyone's share of voice. Annotate the chart where the brand set changes, or recompute history with the new set.
The special meaning of Share of Voice (SoV) in the AI visibility context. In traditional marketing, SoV usually refers to a brand's share of total industry advertising spend. But in AI answer tracking, the denominator is redefined as "the total number of times all tracked brands are mentioned in AI answers." This means SoV depends entirely on the set of competitors you choose to track: tracking 5 brands versus 20 brands produces wildly different SoV for the same brand. SoV is therefore better suited as an observation of relative trends rather than a measure of absolute market position. When comparing across time, you must confirm the brand set hasn't changed; otherwise readers will mistakenly think market share has shifted when in fact only the denominator changed.
Metric three: Average position when listed
Position only exists when the answer is a list and you're included in it. When reporting it, you must also give the count it's based on—it should never appear alone.
SELECT engine,
       COUNT(position)                 AS listed_n,
       ROUND(AVG(position), 2)         AS avg_position,
       ROUND(1.0 * SUM(position = 1) / COUNT(position), 3) AS top1_rate
FROM v_scored
WHERE is_ours = 1
  AND run_date >= date('now', '-28 days')
GROUP BY engine
HAVING COUNT(position) >= 20;
Trap: Average position can improve while your visibility declines. If you drop out of answers where you were ranked fifth, the average of what's left goes up. This is why this metric shouldn't appear on a dashboard without metric one alongside it.
HAVING COUNT(position) >= 20 hides engines with too few listed answers to be meaningful. The threshold is yours to choose, but there has to be one.
Why is average position a conditional statistic? Average position is computed only over the subset of "listed" answers. SQL's AVG(position) automatically ignores rows where position is NULL, so this average naturally reflects only listed answers. The problem is that the denominator (the number of listings listed_n) varies with visibility. When brand visibility declines, answers that previously ranked in lower positions may stop mentioning the brand, causing the remaining "listed" samples to skew toward the top. This is Simpson's Paradox manifesting at the metric level: the subset average improves while the overall picture may be deteriorating. That's why you must show listed_n alongside it and set a minimum sample size threshold.
Metric four: The gap between citation rate and mention rate
Two lines on the same chart. The gap between them is the useful information:
SELECT run_date,
       ROUND(AVG(mentioned), 3) AS mention_rate,
       ROUND(AVG(cited), 3)     AS citation_rate,
       ROUND(1.0 * SUM(mentioned AND NOT cited) / NULLIF(SUM(mentioned), 0), 3)
                                AS mentioned_not_cited
FROM v_scored
WHERE is_ours = 1
GROUP BY run_date
ORDER BY run_date;
A high mentioned_not_cited share means engines know your brand but get their claims about you from elsewhere, usually review sites, forums, or competitor comparison pages. This is worth watching because those third-party pages are what shape the description of you.
Why are mention and citation two different things? In AI answers, "mention" means the brand name appears in the answer text, while "citation" means the answer explicitly attributes the source of brand information (such as a link, reference, or phrasing like "according to [website]"). A brand may be mentioned, but the source supporting its description might be a third-party review, forum discussion, or competitor comparison page. The mentioned_not_cited ratio is precisely the metric that quantifies this "known but without an official source" state. A high ratio means AI is defining your brand using external narratives that you can't directly control. Monitoring this gap helps brands identify which third-party pages are shaping AI's description of them, enabling targeted content interventions.
Metric five: Sentiment composition
If the scorer classifies how each mention is framed (positive recommendation, neutral listing, criticism), show the composition as a stacked share rather than a single "sentiment score":
SELECT strftime('%Y-%W', run_date) AS week,
       ROUND(AVG(sentiment = 'positive'), 3) AS positive,
       ROUND(AVG(sentiment = 'neutral'),  3) AS neutral,
       ROUND(AVG(sentiment = 'critical'), 3) AS critical,
       COUNT(*) AS n
FROM v_scored
WHERE is_ours = 1 AND mentioned = 1
GROUP BY week
ORDER BY week;
(In SQLite, comparisons return 0 or 1, so AVG(x = 'y') is the proportion. In Postgres, write AVG((x = 'y')::int).)
Trap: A net score (positive minus critical) masks changes when positives hold steady but neutrals shift to critical. A stacked view shows it. Also, audit the classifier: sample 50 labeled mentions each month and check them by hand. LLM-based sentiment labels drift when the labeling model changes.
A dashboard layout that holds up in meetings
Five metrics, each placed next to the metric that keeps it honest:
- Top row: Visibility by engine (7-day), with n on hover.
- Beside it: Share of voice by engine, with markers where the brand set changed.
- Second row: Average position + top-1 rate, with listed_n alongside.
- Mentions vs. citations lines on one chart.
- Sentiment as weekly stacked bars.
- Drill down to the raw answer, clickable behind every number. When someone asks "what did it actually say," the answer should be one click away.
That last one is the most-used feature on these dashboards, and it's feasible because the collector stores raw answers (see the data structure post).
When to stop building your own
The SQL above is the easy part. A production-grade dashboard also needs regional breakdowns (answers vary by country), multi-brand separation for agencies, scheduled email reports, drop alerts, and an interface that non-technical stakeholders will actually open.
The original article mentions that Vista AI's Brand Visibility Dashboard bundles all of this: overall and per-engine visibility, share of voice against competitors, sentiment split into positive/neutral/critical, rankings by query, 30-day/90-day/annual trends, regional breakdowns, weekly email reports, and a raw data stream that preserves the full AI answer behind every number.
Whether you build or buy, keep the rule that runs through every query above: every ratio must carry its denominator.
One-line Summary
Five core metrics for building an AI visibility dashboard in SQL, along with their data traps and safeguards.
Paragraph Summary
The article covers five core SQL-based metrics for an AI brand visibility dashboard: 7-day rolling visibility, share of voice, average position when listed, the gap between citation and mention rates, and sentiment composition. Each metric comes with SQL code and specific trap warnings—for example, averaging daily percentages distorts small-sample days, rolling windows assume one row per day, share of voice is affected by brand set changes, average position can move inversely to visibility, and net sentiment scores mask shifts from neutral to critical. The article emphasizes that every ratio must carry its denominator, and recommends safeguards such as pinning the scorer version via a base view, annotating brand set changes on charts, and setting minimum sample size thresholds, so the dashboard holds up under scrutiny in meetings. It ends with a recommended layout and a discussion of when to build versus buy.
Related articles

GPT-Next Leak, Gemini 4 Argon Imminent: AI News Roundup
GPT-Next leak suggests extreme efficiency; OpenAI's 28-day shipping pledge boosts speed 50%; Gemini 4 Argon nears release; Anthropic subscription value report sparks debate.

GPT-Next Leaked, Gemini 4 Argon Speeds Up, Fable 5.5 May Launch Today
OpenAI's GPT-Next model leaks, expected to be extremely low-cost and possibly part of the 28-day release plan; Gemini 4 Argon internal testing accelerates, NanoBanana 2.1 is live; Semi Analysis tests show Claude Max's equivalent API value is about 5 times that of ChatGPT Pro; Fable 5.5 may launch today.

Gemini 4 Argon Launches Globally: Key Highlights from the AI Daily Brief
Google opens Gemini 4 Argon globally across Pro and Ultra subscriptions and the API, and demonstrates robot control. This article rounds up open-source models, Agent infrastructure, cost transparency, and safety governance updates.