The Trap of Interpreting Polling Data: How Clickbait Headlines Distort Your Understanding

How clickbait headlines and hidden denominators in polling data distort public understanding.
Starting from a viral tweet questioning a poll headline about young people's views on democratic socialism, this article dissects common data interpretation pitfalls including the base rate fallacy, survivorship bias, and selective reporting. It extends these lessons to AI benchmark evaluations and offers three principles for building critical data literacy in an information-saturated world.
A Tweet That Sparked a Data Thinking Exercise
Recently, a tweet circulating on Twitter sparked a discussion about how polling data is interpreted. The tweet questioned the headline of a particular article — "almost half of 18- to 34-year-olds see democratic socialism positively" — and pointed out several critical issues with how the data was presented.
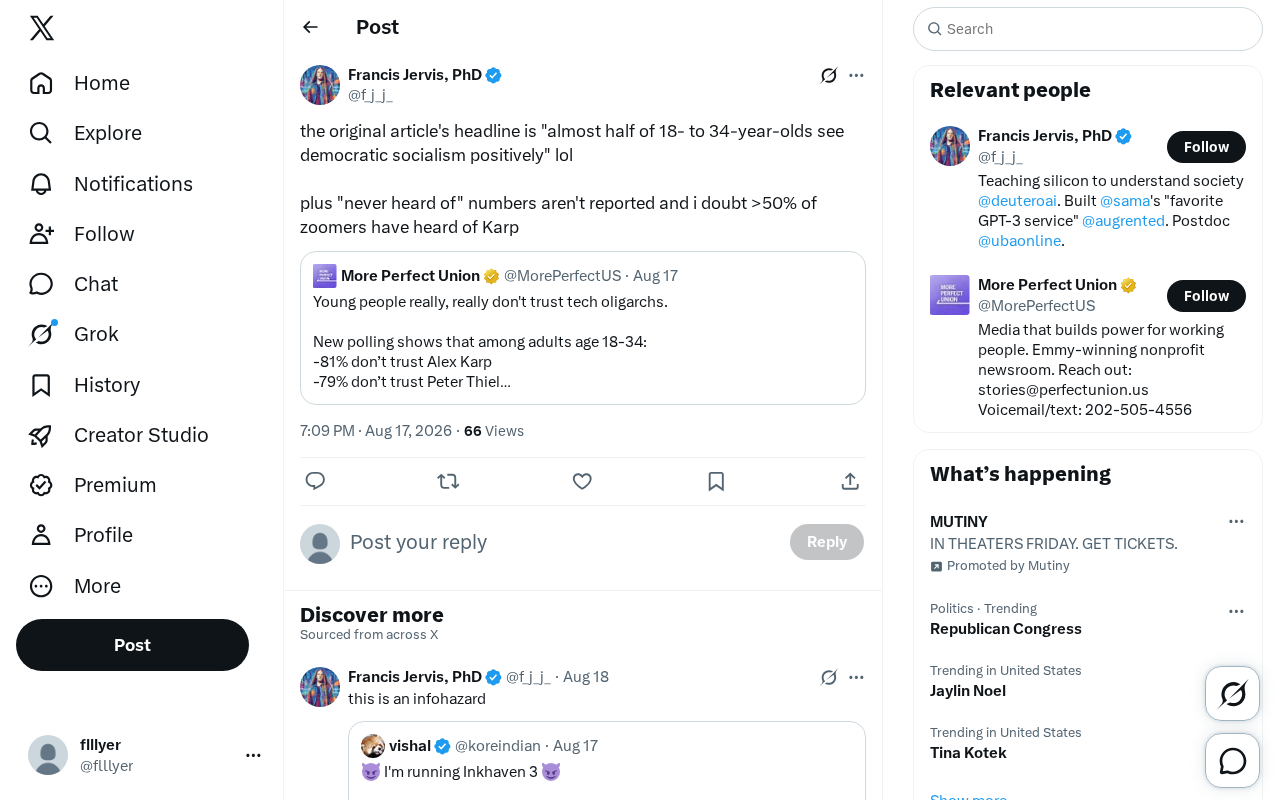
This might seem like just another social media rant, but it touches on a topic equally important in the AI era: how the presentation of data shapes our perception. Whether it's traditional polling or AI model benchmark data, clickbait-style conclusion extraction can lead to serious misunderstanding.
Where Did the "Never Heard Of It" Data Go?
One of the core criticisms raised in the tweet is that the "never heard of" option in the poll was never reported.
In professional survey design, "never heard of" is a standard screening option, part of what's known as "awareness screening." Rigorous polling organizations (such as Pew Research Center and Gallup) typically publish the complete distribution of all response options, including the proportion of "don't know/no answer" responses. When this option is omitted, it's like calculating a Net Promoter Score (NPS) by only counting promoters while ignoring passives and detractors — the resulting number looks impressive but lacks authenticity. In academia, this practice is called "selective reporting," and it's one of the most common forms of statistical manipulation.
This is an extremely critical methodological issue. When a poll claims "nearly half of young people view a certain concept positively," if it doesn't report how many respondents had never even heard of the concept, then the denominator behind that "nearly half" becomes highly questionable.
The Denominator Trap: The Most Subtle Form of Statistical Misleading
Consider this scenario: if 30% of respondents in a survey say they've "never heard of" a particular term, then those who view it positively among the remaining 70% — even if they constitute "nearly half" — actually only reflect the attitudes of a group that already has pre-existing awareness. This filtered sample cannot represent the true inclinations of the entire age demographic.
The "denominator trap" has a more formal name in statistics — the base rate fallacy. It refers to people's tendency to ignore the base rate (i.e., the composition of the denominator) when evaluating probabilities or proportions. Psychologists Daniel Kahneman and Amos Tversky systematically documented this cognitive bias in their research during the 1970s. In data journalism, this problem is especially pronounced: when media reports that "X% of people support a certain policy," readers instinctively assume the denominator is "the entire population," when in reality the denominator may only be "people who are aware of the issue and willing to express an opinion." The gap between the two is often the root cause of misleading interpretations.
The tweet's author further questioned: "I doubt more than 50% of Gen Z has heard of Karp." Karp here refers to Alex Karp, co-founder and CEO of Palantir Technologies. Palantir is a big data analytics company headquartered in Denver that primarily provides data integration and analytics platforms for U.S. intelligence agencies, the Department of Defense, and large enterprises. Although Palantir's market cap briefly exceeded $50 billion after its 2020 IPO and the company holds considerable influence within the tech industry, its business is oriented toward B2G (business-to-government) and B2B (business-to-business), making it largely unknown to average consumers. The tweet author's analogy with Karp illustrates an important point: figures or concepts that are well-known within professional circles may have far lower recognition among the general public (especially younger demographics) than insiders imagine. This "curse of knowledge" effect is extremely common in polling interpretation.
The Chasm Between Headlines and Data
This case reveals a pervasive problem in data communication: headlines tend to extract only the most attention-grabbing numbers while ignoring the methodological details that support them.
A Variant of Survivorship Bias
When we only see the conclusion "nearly half view it positively," it's easy to interpret this as "a prevailing trend among the entire young demographic." But in reality, this number may only hold true within the subset that is familiar with the concept. This is a subtle form of survivorship bias — only those samples that "survived" to the point of having an opinion get counted.
The most famous example of survivorship bias comes from WWII statistician Abraham Wald. At the time, the Allied forces wanted to reinforce bomber armor. Engineers suggested reinforcing the areas with the most bullet holes. But Wald pointed out that the planes that made it back actually proved those areas could withstand hits — the areas that truly needed reinforcement were where bullet holes were scarce, because planes hit in those spots never made it back at all. In the polling context, the "survivors" are respondents who are aware of the concept and have formed a clear opinion. Those who said "never heard of it" are like the downed planes — they vanish from the statistics, but their absence is itself the most important piece of information.
For anyone who relies on data to make judgments, the following questions should become instinctive:
- What is the denominator of this percentage?
- Were "don't know" or "no answer" respondents excluded?
- Does the sample selection introduce systematic bias?
- Does the headline's phrasing match the rigor of the original data?
Implications for Data Literacy in the AI Era
Although this tweet discusses a social poll, the underlying logic applies equally to the AI field.
Benchmark Data Deserves the Same Scrutiny
In AI model evaluations, we frequently see claims like "a certain model achieved 90% accuracy on a certain benchmark." But just like polls, these numbers also conceal methodological issues: How was the test set constructed? Is there data contamination? Is the baseline comparison fair? How many edge cases were excluded?
Data contamination is one of the most serious methodological challenges in AI evaluation today. It refers to models having already "seen" data from the test set during training, resulting in artificially inflated evaluation scores. In 2023, multiple studies revealed that the high scores of large language models like GPT-4 on classic benchmarks (such as MMLU and HumanEval) may partly stem from overlap between training data and test data. Additionally, "benchmark saturation" is an increasingly prominent issue — when multiple models approach perfect scores on a given benchmark, that benchmark loses its discriminating power. This has driven the research community to continuously introduce new evaluation standards, such as GPQA and SWE-bench, in an attempt to establish metrics that better reflect real-world capabilities. However, as long as the boundaries of model training data remain opaque, the data contamination problem will be difficult to eradicate.
Whether it's social science polling or AI benchmarks, the value of data lies not in the final eye-catching number, but in whether the complete process that produced that number can withstand scrutiny.
Three Principles for Building Critical Data Literacy
In an age of information overload, we encounter a massive volume of "conclusions" presented as percentages, rankings, and growth rates every day. This tweet reminds us:
- Beware of clickbait headlines: Media headlines often amplify or oversimplify data conclusions for maximum reach. In journalism, this is known as the "framing effect" — the same dataset can convey entirely different messages through different narrative frames. Nobel laureate in economics Richard Thaler's research shows that people react very differently to "90% surgery success rate" versus "10% surgery mortality rate," even though both are mathematically equivalent statements.
- Question the methodology: Every statistic should be traced back to how it was collected and calculated. How large is the sample? Was sampling random or convenience-based? What's the confidence interval? What's the margin of error? These seemingly dry technical details are precisely what determine whether a number is gold or garbage.
- Pay attention to what's hidden: The data that goes unreported (such as the "don't know" option) often tells you more than what's reported. In statistics, the handling of missing data is a discipline in itself — patterns of missing data are often not random but systematic, and ignoring them leads to severe inferential bias.
Conclusion
This seemingly casual Twitter rant is actually a vivid lesson in data literacy. It reminds us that whether we're facing social polls, market research, or AI model performance reports, we should never stop at the conclusions offered by headlines.
Truly valuable insights come from questioning how data is generated and from being sensitive to "the information that was omitted." In a world increasingly dependent on data-driven decisions, this kind of critical thinking is not optional — it's an essential foundational skill.
Key Takeaways
Related articles

Bilibili's Hit Dify Tutorial: A Practical Guide to Building 20+ AI Apps from Scratch
A distilled guide to Bilibili's top-rated Dify tutorial: Windows + Docker deployment, MySQL connection, five app types, model integration strategy, and publishing.

Agent Skills Beginner's Guide: From Concepts to Multi-Agent Collaboration in Practice
A comprehensive guide to Agent Skills: core concepts, components, the importance of Description, standardization, beginner learning paths, and multi-agent collaboration.

One Neuron Detects Both Cats and Cars? We Reproduced It and Found a New Explanation
The cat-car neuron reinterpreted: researcher Cammarata argues it distinguishes pointy from round, not cats from cars. We reproduced the experiment and found the new explanation holds on most inputs—but cars are the exception. The interpretability debate continues on language models.