Trimming Visibility Graph Topology Metrics: How 3 Features Outperform 21 in Network Attack Detection

3 clustering coefficient metrics beat 21 NVG topology features in network attack detection, cutting compute time by 96%.
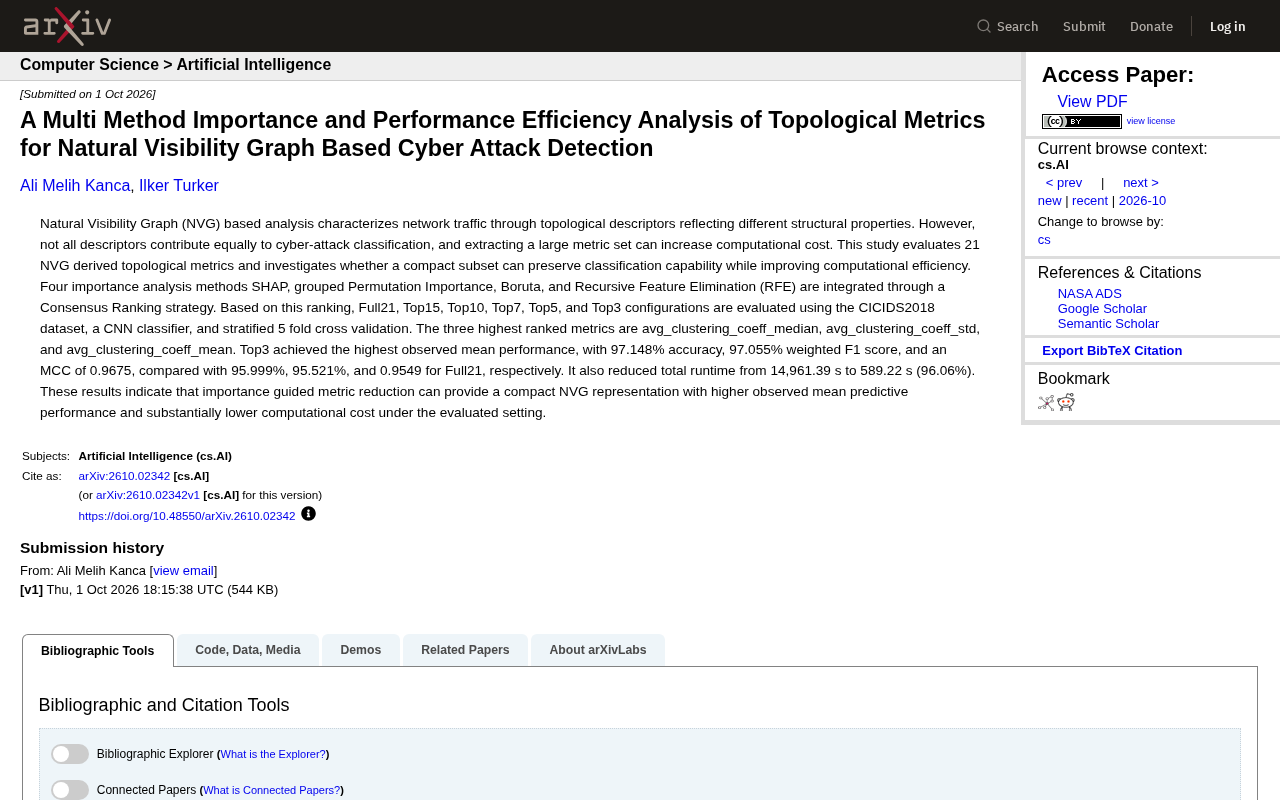
This study explores how to identify the most compact and effective subset from 21 NVG-derived topological metrics for network attack detection. By integrating SHAP, Grouped Permutation Importance, Boruta, and RFE through consensus ranking, the top three metrics were all clustering coefficient variants. Using only these 3 features, the Top3 configuration achieved 97.148% accuracy on CICIDS2018 with a CNN classifier — outperforming all 21 metrics (95.999%) while reducing compute time from 14,961 to 589 seconds (a 96% drop). The findings suggest redundant features introduce noise, and a compact high-quality subset lets classifiers focus on the most discriminative signals.
Background: When Network Traffic Becomes a Graph
Network attack detection has long relied on extracting and classifying traffic features. Natural Visibility Graphs (NVG) offer a different approach — they convert time-series network traffic into a graph structure, then use the graph's topological descriptors to characterize the structural properties of the traffic. Different topological metrics capture variations across dimensions such as clustering, connectivity, and path distribution, and these variations can often reveal fundamental differences between normal and attack traffic.
The challenge is that there are many topological metrics available for extraction. This study, published on arXiv, points out that not all descriptors contribute equally to attack classification, and extracting a large set of metrics significantly raises computational costs. The researchers thus posed a core question: can we identify a compact subset of metrics that maintains classification capability while dramatically improving computational efficiency?
The construction principle behind Natural Visibility Graphs (NVG) is worth briefly explaining. Given a time series (such as the change in byte count or packet count over time), NVG treats each time point as a node in the graph. An edge exists between two nodes if and only if the "line of sight" between those two time points is not blocked by any taller data point in between — analogous to standing among a row of pillars of varying heights, where two pillars that can directly "see" each other are connected. This construction rule naturally preserves both local and global structural information of the time series: burst traffic forms highly connected hub nodes, while steady traffic produces a more uniform connection distribution. By analyzing the topological properties of the resulting graph, researchers can characterize traffic behavior without relying on payload content — making this approach particularly promising for encrypted traffic detection.
Cross-Voting Across Four Methods: The Consensus Ranking Strategy
The study evaluated 21 topological metrics derived from NVG. Rather than relying on a single feature importance method to determine which metrics truly matter, the authors integrated four common approaches:
- SHAP: Game-theory-based feature contribution analysis
- Grouped Permutation Importance: Observing performance degradation by shuffling features
- Boruta: A random forest-based feature selection algorithm
- Recursive Feature Elimination (RFE): Iteratively removing less important features
Each of these methods has its own preferences and blind spots, and using any one in isolation can introduce bias. The study fused the results from all four through a Consensus Ranking strategy to produce a more robust importance ranking. This multi-method cross-validation approach effectively reduces selection bias from any single method, lending greater credibility to the final selected metrics.
The Top Three Ranked Metrics
After consensus ranking, the top three metrics all came from the same family — average clustering coefficient:
avg_clustering_coeff_median(median of average clustering coefficient)avg_clustering_coeff_std(standard deviation of average clustering coefficient)avg_clustering_coeff_mean(mean of average clustering coefficient)
All three metrics sharing the same origin in clustering coefficients suggests that, under the NVG representation, the local clustering characteristics of network traffic play a decisive role in distinguishing attack behavior. This is a particularly illuminating finding — complex global topological measures are not necessarily more effective than simple local structural metrics.
The clustering coefficient measures the degree to which a node's neighbors are interconnected with each other, ranging from 0 to 1. If all of a node's neighbors are also connected to each other, the node's clustering coefficient is 1; if none of the neighbors are connected, it is 0. In the NVG context, a high local clustering coefficient means that adjacent time points form densely interconnected "clusters," typically corresponding to highly self-similar or regularly rhythmic traffic patterns over short time windows. Attack traffic (such as scanning or flooding) and normal traffic tend to exhibit systematic differences in this kind of local density structure, which explains why the mean, median, and standard deviation of the clustering coefficient collectively emerge as the most discriminative feature combination — they capture the central tendency and dispersion of local clustering intensity respectively, characterizing the same structural property from complementary angles.
Experimental Design and Results: Less Is More
The study used the CICIDS2018 dataset with a CNN classifier and stratified 5-fold cross-validation to ensure evaluation reliability. The authors compared six metric configurations: Full21 (all 21), Top15, Top10, Top7, Top5, and Top3.
The results were counterintuitive — the Top3 configuration with the fewest metrics achieved the highest average performance:
| Configuration | Accuracy | Weighted F1 | MCC |
|---|---|---|---|
| Top3 | 97.148% | 97.055% | 0.9675 |
| Full21 | 95.999% | 95.521% | 0.9549 |
Using only three metrics not only avoided any loss in accuracy, but actually outperformed the full 21-metric approach across all three measures: accuracy, weighted F1 score, and Matthews Correlation Coefficient (MCC).
A Dramatic Boost in Computational Efficiency
Beyond performance, the efficiency gains are even more striking. The Top3 configuration compressed total runtime from 14,961.39 seconds for Full21 down to 589.22 seconds — a reduction of 96.06%. In other words, the computational overhead dropped to roughly 1/25th of the original.
This has significant practical implications. Network attack detection often demands near-real-time response, and a large metric extraction pipeline can become a bottleneck. A compact representation that is both fast and accurate makes deploying NVG-based detection solutions on edge devices or in high-throughput environments far more feasible.
The Matthews Correlation Coefficient (MCC) appearing in the evaluation table deserves special attention. Compared to accuracy and F1 score, MCC is more reliable in class-imbalanced scenarios — it simultaneously accounts for true positives, false positives, true negatives, and false negatives, and only gives a high score when the classifier performs well across all classes. Network intrusion detection datasets typically suffer from severe class imbalance (normal traffic far outnumbers attack traffic), so MCC more accurately reflects actual detection capability. The Top3 configuration achieved an MCC of 0.9675 versus 0.9549 for Full21, meaning its performance advantage does not stem from overfitting on the majority class, but rather from a genuine improvement in recognizing minority-class attacks.
Why Fewer Features Actually Work Better
The seemingly paradoxical conclusion that fewer metrics yield higher performance actually aligns with general machine learning principles. Redundant features not only increase computational burden but can also introduce noise that disrupts the classifier's decision boundaries. When four different importance methods consistently identify clustering-coefficient-related metrics as the most critical, removing the remaining 18 metrics effectively strips out a large volume of low signal-to-noise inputs, allowing the CNN classifier to focus on the most discriminative signals.
However, it's important to note that this conclusion was reached under a specific experimental setup — a single dataset (CICIDS2018), a single classifier (CNN), and a particular cross-validation scheme. The researchers themselves carefully qualified their conclusions with the phrase "under the evaluated setting." Whether these findings generalize to other datasets, other attack types, or other classification models still requires further validation.
Implications for Cybersecurity Practice
This study provides a clear methodological template: in graph-based network attack detection, importance-guided metric reduction is an optimization path worth prioritizing. It simultaneously improves both predictive performance and computational efficiency — a rare win-win in engineering practice.
For teams developing intrusion detection systems (IDS), several takeaways stand out:
- Use multi-method consensus ranking instead of a single feature selection approach for more robust results
- Don't default to "more features is better" — compact subsets may outperform
- Clustering coefficient metrics deserve particular attention under NVG representations
Of course, as a preprint just published on arXiv (arXiv:2610.02342v1), the findings have not yet undergone peer review, and readers should exercise appropriate caution when citing them. Nevertheless, the "less is more" approach it demonstrates offers valuable reference for deploying visibility graphs in the cybersecurity domain.
Related articles

Free Unlimited Claude Code Solution: Agnes AI + CC Switch Setup Guide
No paid subscription needed — pair the free AI platform Agnes AI with the open-source tool CC Switch to provide a backend for Claude Code, enabling unlimited free calls to text, image, and video models. This guide covers the full setup, test results, and usage boundaries.

A Complete Zero-Cost Guide to Getting Started with Claude Code for Beginners in China
A beginner's guide to Claude Code for users in China: two installation methods (command line and IDE plugin), full configuration steps for replacing the official API with the free domestic LongCat model, and a hands-on demo of building a small tool with natural language, plus tips.

When the NSA Gets Involved: The AI Supply Chain Crisis Behind Open-Source CVEs and API Key Hijacking
Multiple open-source projects disclosed severe CVEs in one day, PHP flaws alarmed the FBI, and Railway and OpenCode were breached with API keys stolen. This article breaks down the vulnerability window, AI-accelerated exploitation, and the AI supply chain crisis behind the API key black market, with a developer defense checklist.