Uptime Kuma: The Self-Hosted Monitoring Powerhouse Surpassing 93K GitHub Stars

With 93K stars, Uptime Kuma is a top self-hosted monitoring pick—lightweight and easy, but not for large-scale use.
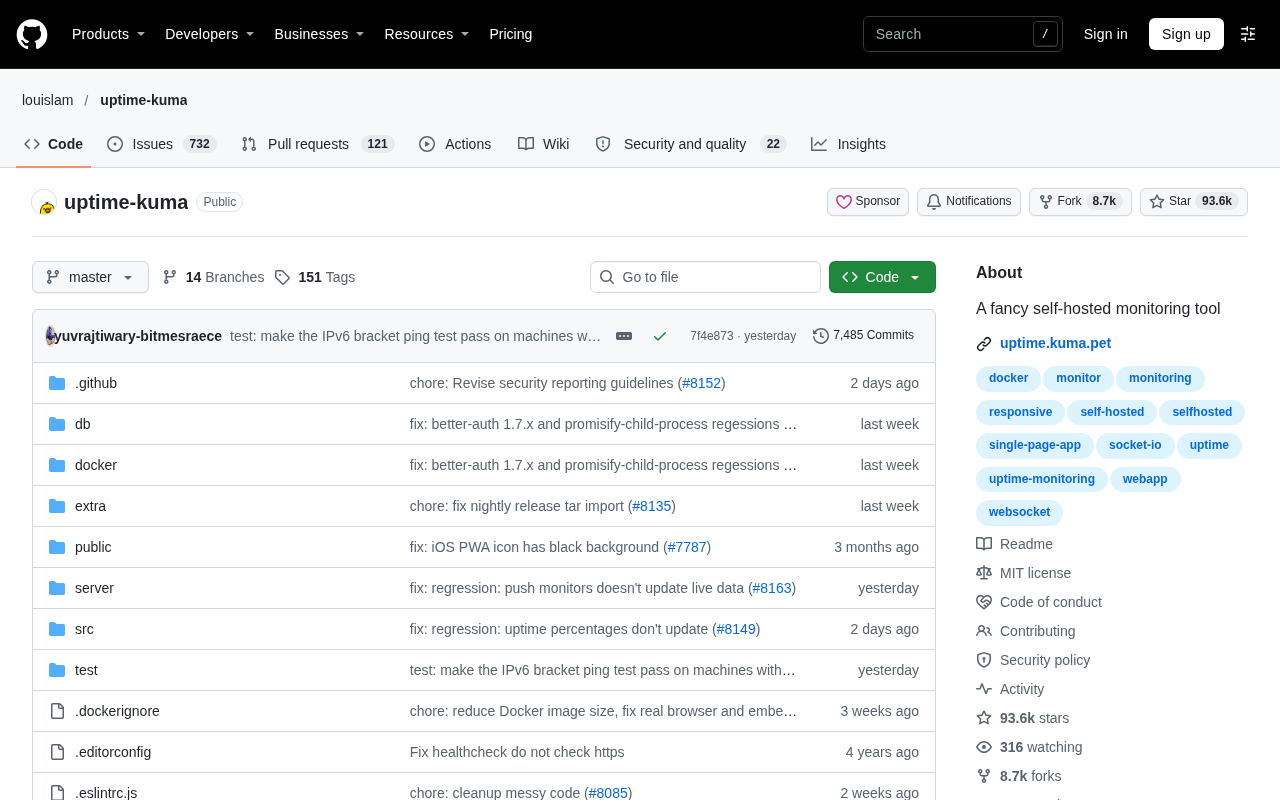
Uptime Kuma is an open-source self-hosted monitoring tool by louislam with 93,614 GitHub stars and 8,706 forks, gaining 61 stars daily. Written in JavaScript with a friendly web UI, it supports HTTP(s), TCP, Ping, DNS, Push monitoring, dozens of notification channels, and public status pages. It greatly lowers the setup barrier compared to Zabbix and Prometheus, making it ideal for individuals and small teams. It deploys lightweight via Docker, but isn't designed for large-scale distributed monitoring—complex topologies and long-term metrics still need more specialized solutions.
In the world of open-source monitoring tools, Uptime Kuma is rapidly winning over developers and operations teams. Launched by louislam, the project has already amassed 93,614 GitHub stars and 8,706 forks, gaining 61 stars in a single day—momentum that shows no sign of slowing. The author describes it as "a fancy self-hosted monitoring tool," but its capabilities go far beyond "fancy."
Why Uptime Kuma Deserves Attention
The core value of Uptime Kuma lies in bringing enterprise-grade monitoring experience to self-hosted scenarios for individuals and small-to-medium teams. Compared to traditional solutions like Zabbix and Prometheus, it offers an extremely friendly web interface and out-of-the-box monitoring types, dramatically lowering the barrier to building a monitoring system.
The project is written in JavaScript, which means it benefits from a massive developer ecosystem and a low barrier to secondary development. For full-stack developers, a Node.js-based tech stack makes customization readily accessible.
Self-hosted refers to deploying software on servers that users own or rent, rather than using a vendor-provided cloud SaaS service. For monitoring tools, self-hosting means monitoring data, alert configurations, and status pages all remain within your own infrastructure, never passing through a third party. The difference from traditional self-hosted solutions like Zabbix and Prometheus lies in deployment complexity: the latter typically require planning databases, configuring collectors, and setting alert rules, whereas Uptime Kuma runs as a single container with built-in SQLite storage and works out of the box. The trade-off of self-hosting is that you must handle server operations, backups, and availability assurance yourself—if the monitoring system itself goes down, it won't automatically alert you, which is the key consideration compared to SaaS solutions.
Feature Highlights: More Than Just "Fancy"
Although the author humbly uses the word "fancy," Uptime Kuma's feature coverage is quite comprehensive:
- Multi-protocol monitoring: Supports HTTP(s), TCP, Ping, DNS records, Push, and many other monitoring types, covering needs from websites to APIs to infrastructure.
- Real-time notifications: Integrates with dozens of notification channels including Telegram, Discord, Slack, and email, reaching you the moment an incident occurs.
- Beautiful status pages: Generates public-facing status pages so users or customers can see service health in real time.
- Multi-language support: The community has contributed rich language packs, with a friendly Chinese interface.
These features are integrated into a clean dashboard with responsive design, delivering a great experience on mobile devices as well.

Push monitoring is a monitoring mode that works in reverse from active probing: Uptime Kuma doesn't actively visit the target. Instead, it generates a unique Push URL, and the monitored task (such as a scheduled script, backup job, or Cron task) proactively sends a heartbeat request to that URL upon successful execution. If no heartbeat is received within the configured time window, Uptime Kuma determines the task is abnormal and triggers a notification. This mode is ideal for monitoring events that "should happen regularly but didn't"—such as a daily backup not running or queue consumption stalling—scenarios that HTTP probing cannot cover.
DNS record monitoring periodically queries the resolution results of a specified domain and compares them against expected values. It can detect accidental record changes, DNS hijacking, or resolution service failures, making it a common technique for domain asset security and availability monitoring.
A Pragmatic Choice for Self-Hosted Monitoring
For teams that prioritize data privacy and cost control, self-hosted monitoring is essential. Uptime Kuma can be deployed in any Docker-capable environment with relatively lightweight resource usage. Compared to SaaS monitoring services that charge per monitoring node, Uptime Kuma's one-time deployment cost is very friendly to small and medium teams.
The project's high star count also reflects community recognition of its stability and practicality. The 8,706 forks indicate that many developers are building on it for secondary development or internal customization, further enriching its ecosystem.
Docker is a containerized runtime environment that packages applications and their dependencies into images, ensuring consistent deployment results across different hosts. Uptime Kuma's official image can be launched directly via docker run, with data persisted through mounted volumes; upgrading requires only pulling the new image and rebuilding the container. For production use, you'll typically also need a reverse proxy (such as Nginx or Caddy) to provide HTTPS, since status pages and notification callbacks involve credential transmission. Note that the default SQLite database inside the container suits small-to-medium data volumes; if monitoring items and heartbeat history grow quickly, plan a data retention strategy or consider external database support to avoid continuous disk bloat.
Use Cases and Limitations
Uptime Kuma is ideal for individual site owners, startup teams, and small-to-medium businesses with internal monitoring needs. It can quickly establish website availability monitoring and alerting systems.
However, it was not designed for large-scale distributed monitoring. For enterprise-grade scenarios requiring monitoring of thousands of nodes, complex topologies, and long-term metric storage, more specialized solutions are still necessary. Uptime Kuma's positioning is lightweight, easy to use, and beautiful—not all-encompassing.
Quick Start Recommendations
If you're planning to try it, Docker deployment is recommended; the official docs provide a concise docker run command. After deployment, adding your first HTTP monitor requires only a URL and check interval—you'll see monitoring data within minutes. For users needing deeper customization, the project's open-source nature lets you freely modify the frontend interface or extend notification channels.
Uptime Kuma's success confirms a trend: developer tools are shifting from "feature stacking" to "experience first." A beautiful, easy-to-use, self-hosted monitoring tool truly solves real pain points.
This article is based on information from the GitHub project page; data is as of the project's public page.
One-line Summary
Uptime Kuma has become a popular choice for self-hosted monitoring with 93K stars—lightweight and easy to use, but not built for large-scale deployments.
Paragraph Summary
Uptime Kuma is an open-source self-hosted monitoring tool by louislam, with 93,614 GitHub stars and 8,706 forks, gaining 61 stars in a single day. Written in JavaScript, it offers a friendly web interface and supports HTTP(s), TCP, Ping, DNS, Push, and other monitoring types, integrating dozens of notification channels including Telegram, Discord, Slack, and email, plus public status pages. Compared to Zabbix and Prometheus, it dramatically lowers the barrier to building monitoring systems, making it ideal for individual site owners and small-to-medium teams looking to quickly establish availability monitoring and alerting. It can be deployed lightweight via Docker at a cost-friendly level for smaller teams. However, it isn't designed for large-scale distributed monitoring of thousands of nodes—complex topologies and long-term metric storage still call for more specialized solutions.
Related articles

Gemini 4 Neon Review: Benchmark Scores Rival Carbon, API Pricing and Quota Breakdown
Google Gemini 4 Neon is now live, benchmark scores closely tracking Carbon, API pricing 3/15 at twice Hydrogen's rate. This article compiles Bilibili creator testing: Neon can replace 90% of Carbon scenarios, AntiGravity quota consumption is only one-third of Carbon, plus subscription channel restrictions and 2API ban risks.

Gemini 4 Helium Coming Soon? Signals of Google Loosening Subscription Restrictions
Google team member hints releases will continue; community speculates Gemini 4 Helium (Flash Lite) may be next. Subscription ban controversy gets a response as product lead says "Soon," suggesting restrictions may be lifted. This article covers Gemini developments, OpenAI Coding Agent and risk management, Doubao real-time audio-video API, and compute business dynamics.

AI-Assisted React Development in Practice: Optimizing a Video App and Handling Errors
A 14-year veteran developer demonstrates AI-assisted React video app optimization: compressing video from 80MB to 5MB (~94%) via ImageKit, plus reliable error handling and retry mechanisms. Includes planning, code understanding, and verification methods for working with AI.