Why Do B2B Quarterly Revenue Forecasting Models Keep Failing? A Practical Optimization Guide

B2B quarterly revenue forecasting struggles stem from sparse data and business volatility, not algorithmic complexity.
This article analyzes a common B2B forecasting challenge: building a quarterly revenue model from two years of data that still yields poor variance. The core issue isn't the algorithm — it's the data structure. Two years of quarterly data produces only 8 observations, and B2B revenue is heavily skewed by a few large accounts. The article proposes three fixes: decompose revenue into bottom-up drivers, start with simple baselines like exponential smoothing and linear regression, and replace point forecasts with prediction intervals evaluated via rolling-window backtesting. The key insight: leading indicators like pipeline data matter far more than lagged revenue history.
A Common Yet Tricky Problem
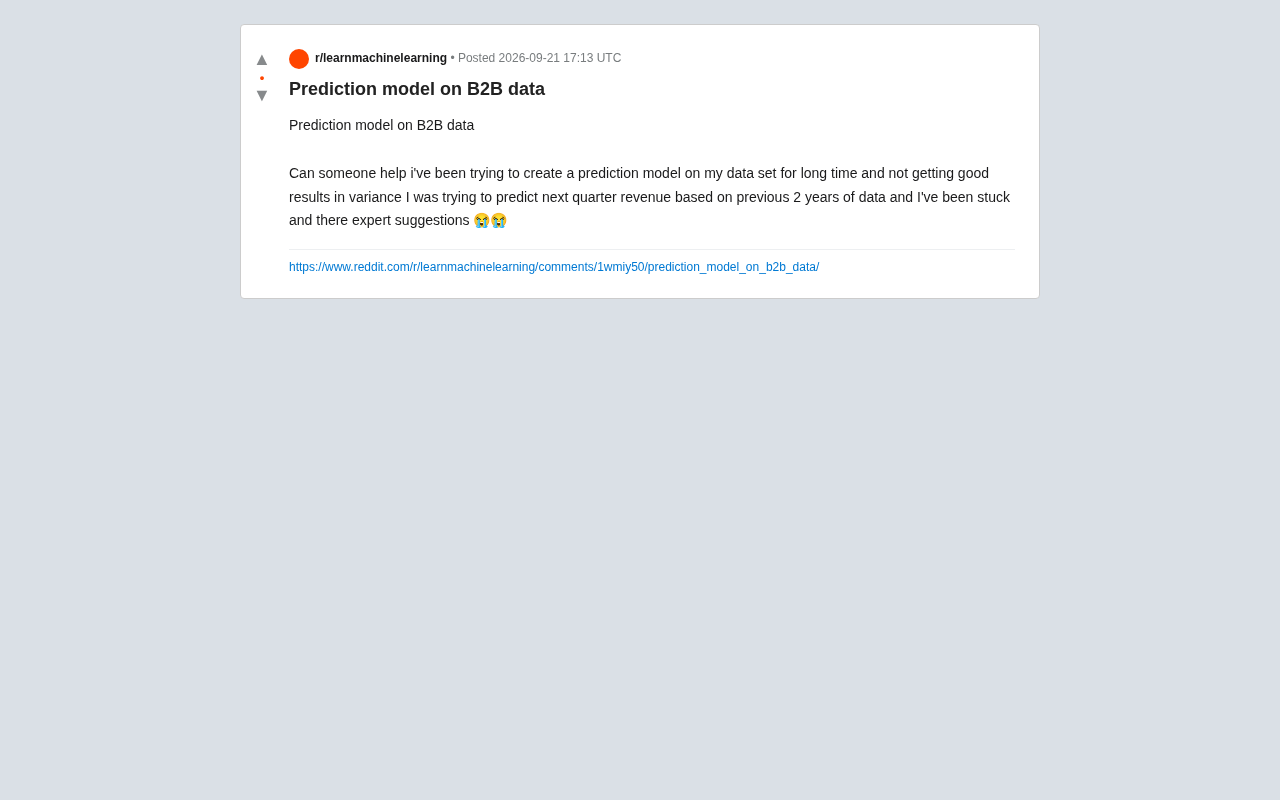
In a Reddit data science community, a user posted a desperate question: they had been trying to forecast next quarter's B2B revenue using two years of historical data, but after extensive experimentation, the model's variance remained poor and no amount of tuning could produce reliable results.
This problem sounds straightforward, but it cuts to the heart of the most fundamental pain points in time series forecasting and B2B business modeling. B2B data typically has small sample sizes, strong cyclical patterns, and is highly susceptible to fluctuations caused by a handful of large clients. Applying standard machine learning methods directly to this kind of data rarely yields stable performance. Drawing from this case, let's walk through a practical framework for diagnosing and improving B2B revenue forecasting models.
Why Forecasting Quarterly Revenue from Two Years of Data Is So Difficult
The user's core struggle was "poor variance performance" — in other words, the model had very little explanatory power over revenue fluctuations, with large and unstable gaps between predicted and actual values. The root cause typically isn't the algorithm itself, but the data structure.
Two years of historical data, when aggregated by quarter, yields only 8 data points. Even at the monthly level, you only get 24. Training a model on such a small sample — one that needs to capture both trends and seasonality — is almost guaranteed to result in either overfitting or underfitting. This is the most classic trap in B2B forecasting: "two years of data" sounds substantial from a business perspective, but once converted into time series observations, the information content is extremely limited.
Furthermore, B2B revenue is heavily dependent on large accounts. A handful of major contract wins or losses can cause dramatic swings in a given quarter's numbers — structural shocks that pure historical extrapolation models simply cannot capture.
Directions for Diagnosis and Optimization
Re-examining Data Granularity and Features
Rather than trying to predict at the quarterly aggregation level, consider drilling down to finer granularity. Break revenue into its underlying drivers — such as "number of clients × average contract value" or "new bookings + renewals − churn" — model each component separately, then roll them up. This bottom-up approach is far more robust than predicting the top-line total directly, and it aligns better with how B2B businesses actually operate.
At the same time, incorporate external features — the dollar value of opportunities in the sales pipeline, weighted win probabilities, historical conversion rates, and seasonality indicators. The leading indicators of B2B revenue are usually hiding in your CRM, not in historical revenue figures.
Sales Pipeline refers to the collection of all active opportunities tracked in a CRM system, typically including deal size, expected close date, and current stage (e.g., initial contact, demo, contract negotiation). For B2B revenue forecasting, weighted pipeline value (deal size × historical win rate at that stage) is an extremely valuable leading indicator, because it reflects the "revenue reservoir" for the coming quarters rather than outcomes that have already occurred. Incorporating pipeline data as an input feature is essentially injecting the sales team's business judgment into the model — a source of information that pure historical extrapolation simply cannot replicate.
Returning to Simple Baselines Before Complex Models
With small sample sizes, deep learning models or complex ensemble methods often do more harm than good. Start by establishing simple baselines:
- Moving average / Exponential smoothing: Works well for revenue with stable trends
- Naïve seasonal model: Uses the same period from the prior year as a benchmark
- Linear regression + a few strong features: Highly interpretable and resistant to overfitting
These baselines help you determine whether the problem lies in the data or the model. If even simple models perform poorly, it indicates insufficient signal in the data — which means you need to go back to feature engineering.
Exponential Smoothing is a family of classic time series methods built on the idea of assigning higher weights to more recent observations, with weights decaying exponentially over time. Holt-Winters triple exponential smoothing accounts for both trend and seasonality simultaneously, making it particularly well-suited for revenue data with regular cyclical patterns. Compared to methods like ARIMA, exponential smoothing has fewer parameters, is easier to interpret, and handles small samples better — in a scenario with only 8 quarterly data points, fewer model parameters often lead to more stable results.
Naïve Seasonal Model is even simpler: it uses the actual value from the same period in the prior year as the forecast. The value of this approach lies in the clear "capability floor" it establishes. If your complex model can't beat this baseline, it hasn't truly learned meaningful patterns — it's overfitting to noise.
Correctly Diagnosing the Variance Problem
When the user mentions poor variance, it's important to distinguish between two scenarios: (1) the model's predictions are inherently unstable (high variance, overfitting), or (2) the underlying data is genuinely highly volatile. The first case calls for regularization, feature reduction, and more data. The second suggests that point forecasting is fundamentally limited in value — switching to interval forecasting that provides confidence ranges rather than single numbers is often more appropriate, and leadership tends to find it more credible.
For scenarios with only 8 quarterly data points, time series cross-validation (e.g., rolling-window backtesting) is far more reliable for model evaluation than a random train-test split.
Time Series Cross-Validation (Rolling-Window Backtesting) works as follows: fix a training window size, then sequentially roll forward to forecast the next time step, accumulating multiple test errors and averaging them. For example, train on quarters 1–4 to forecast quarter 5, then train on quarters 1–5 to forecast quarter 6, and so on. This approach preserves temporal ordering, avoids data leakage ("using future data to predict the past"), and produces evaluation results that more closely reflect real deployment conditions.
Prediction Intervals express the uncertainty range around a forecast — for example, "next quarter's revenue will be between $8M and $12M with 80% confidence." For high-volatility B2B businesses, interval forecasts are both more honest and more practical than point forecasts. They force stakeholders to acknowledge the existence of uncertainty, which in turn enables scenario planning and risk buffering — rather than relying on a deceptively precise single number.
Advice for Anyone Facing a Similar Challenge
When B2B revenue forecasting hits a wall, don't rush to swap in a more sophisticated algorithm. What actually determines success or failure comes down to:
- Sufficient data: When sample sizes are too small, no model can save you. Consider sourcing additional historical data or expanding observations using monthly or weekly granularity.
- The right features: Leading indicators (pipeline, opportunities, conversion rates) are far more valuable than lagging historical revenue figures.
- Realistic targets: Single-point precision forecasting is unrealistic for high-volatility businesses. Interval forecasting and scenario analysis are more pragmatic approaches.
At its core, B2B forecasting is about translating business understanding into features and model structure — not a hyperparameter tuning competition. When results remain consistently poor, stepping back to examine the data foundation and underlying business logic is usually more productive than continuing to dig deeper into algorithms.
This Reddit post is highly representative — it reminds us that the hardest part of data science is often not the model itself, but figuring out how to tell a coherent business story with limited data.
Related articles

Uber Deploys ChatGPT Work Company-Wide: AI in the Workplace Enters the Scaled Implementation Phase
Uber deploys ChatGPT Work to 30,000+ employees, extending it from engineering to all roles. We analyze its expert-engineer pairing, end-to-end automation, and questions of AI control and power concentration—insights for scaling AI in the workplace.

Shift at Midnight Hands-On: When "ID Verification" Becomes Alien Hunting
Shift at Midnight blends ID verification with horror survival in a four-player co-op game. We break down its inspection mechanics and chaotic humor.

Zelensky Recounts the Outbreak of War: I Need Ammunition, Not a Ride
Zelensky recalls the first day of war in a YouTube interview: farewell to family, rejecting Biden's evacuation offer with "I need ammunition, not a ride," and how Bucha shaped his stance on compromise and peace talks.