TraceLLM: An Open-Source LLM Observability Platform Built on OpenTelemetry

Open-source LLM observability platform using OpenTelemetry for production AI monitoring.
TraceLLM is an open-source observability platform designed for production-grade AI applications. Built on the OpenTelemetry (OTLP) standard, it provides Prompt execution tracing, granular Token consumption monitoring, latency analysis, and full distributed tracing via Spans. By exporting data in OTLP format, it integrates seamlessly with existing observability backends like Jaeger, Grafana Tempo, and Datadog, avoiding vendor lock-in while helping engineering teams quickly identify performance bottlenecks and cost issues in LLM workflows.
As Large Language Model (LLM) applications transition from prototypes to production environments, a long-underestimated problem has gradually surfaced: When your AI application experiences latency spikes, runaway Token costs, or call failures, can you quickly pinpoint the root cause? TraceLLM, an open-source tool recently launched on Product Hunt, was built to solve exactly this pain point. With the tagline "OpenTelemetry for production AI applications," it brings mature observability standards into AI workflows.
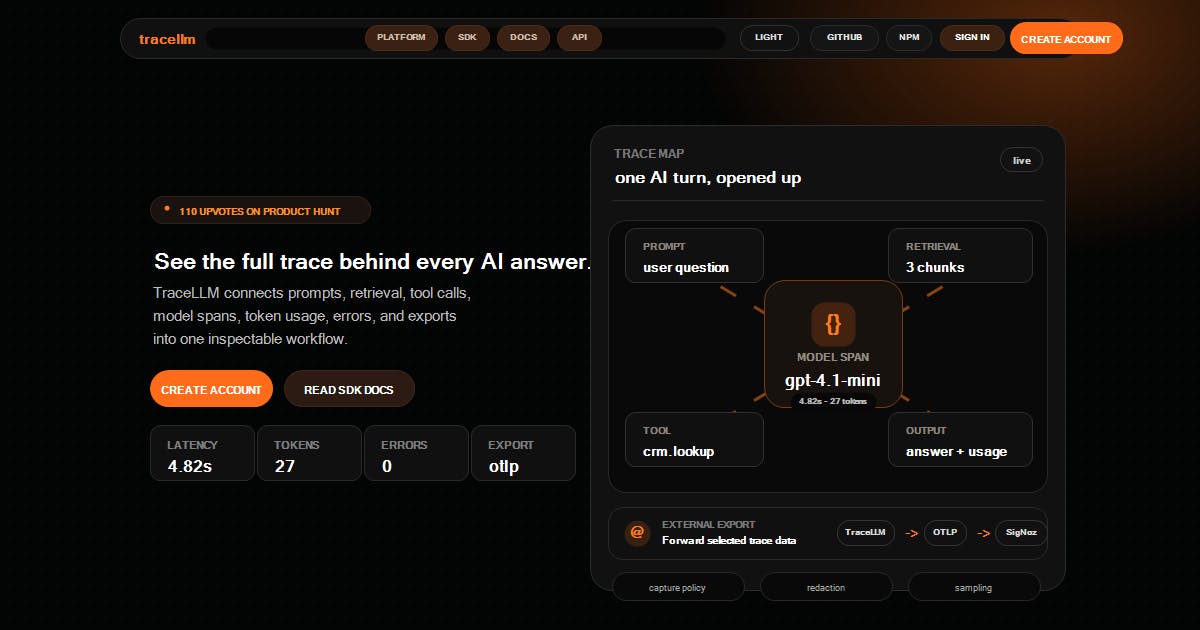
The project was created by Jyotishmoy Deka. After launch, it received 89 upvotes, ranking 11th on that day's leaderboard, and was categorized under Open Source, Developer Tools, and GitHub. While the vote count isn't blockbuster by Product Hunt standards, the problem it addresses is highly representative of challenges in AI engineering.
Why LLM Applications Need Specialized Observability Tools
Traditional software monitoring systems are already quite mature. The three pillars—Logs, Metrics, and Traces—form a complete observability framework. This was first proposed by Peter Bourgon in 2017 and has since been widely adopted by the industry. However, LLM applications introduce an entirely new set of observational dimensions that generic APM (Application Performance Monitoring) tools struggle to cover.
First, there's the need for Prompt execution tracing. A complex AI application often involves multi-turn Prompt chaining, context injection, RAG retrieval result embedding, and other steps. Any anomaly in these stages can degrade output quality, and these issues are difficult to reconstruct from traditional logs. Take RAG (Retrieval-Augmented Generation) as an example—it's one of the most mainstream architectural patterns for production-grade LLM applications. Its core idea is to retrieve relevant document fragments from an external knowledge base before generating an answer, injecting them as context into the Prompt to improve accuracy and timeliness. A typical RAG pipeline includes document chunking, vectorization (Embedding), storage in a vector database, user query vectorization, similarity search, re-ranking, context injection, and finally LLM generation. Each step can introduce latency and errors—for example, Embedding API timeouts, vector database query slowdowns, or irrelevant retrieval results causing hallucinations. This is precisely where LLM-specific observability tools prove their value: they need to trace these AI-specific intermediate steps, not merely record final inputs and outputs.
Second is granular Token consumption monitoring. Tokens are directly tied to cost. In LLM pricing models, the Token is the fundamental billing unit—one Token corresponds to roughly 4 characters or 3/4 of a word in English, and approximately 1.5-2 characters in Chinese. Taking GPT-4o as an example, input Tokens and output Tokens are priced differently (output is typically more expensive), and pricing varies dramatically across models. A poorly designed Prompt template or an uncontrolled loop of calls can generate hefty bills in a short time. In production environments, common causes of Token cost overruns include: overly long system prompts, untruncated context windows, Agent loop calls, and RAG retrieval results without relevance filtering. An unoptimized enterprise AI application can see monthly Token costs skyrocket from hundreds to tens of thousands of dollars. Without fine-grained Token tracking, teams often only discover the problem when the month-end bill arrives—by which point the cost damage is irreversible.
Additionally, there's latency and error monitoring for model calls. LLM inference response times fluctuate significantly, with notable performance differences across models, regions, and load levels. Without targeted monitoring, it's difficult to identify bottlenecks before they impact users.
Core Features and Capabilities of TraceLLM
According to its official description, TraceLLM is an observability platform for production AI applications, with core capabilities centered on full-chain monitoring of LLM workflows.
Comprehensive LLM Metrics Monitoring
- Prompt execution tracing: Records the execution process and results of each Prompt, supporting multi-turn conversation chain reconstruction
- Token consumption statistics: Granular recording of input/output Token usage for cost attribution and budget control
- Latency analysis: Monitors response time for each model call to identify performance bottlenecks
- Spans tracing: Reconstructs the complete call path of a request using distributed tracing. A Span is a core concept in distributed tracing systems, representing the time interval of an operation. Each Span contains the operation name, start/end timestamps, Attributes, Events, and Status. Multiple Spans form a Trace tree through parent-child relationships, fully describing how a request propagates through a distributed system. In LLM application scenarios, a Trace might include: user request reception (root Span) → query rewriting (child Span) → vector retrieval (child Span) → context assembly (child Span) → LLM inference call (child Span) → output post-processing (child Span). This hierarchical tracing approach lets engineers precisely locate which stage is causing latency bottlenecks.
- Error capture: Records call failures, timeouts, rate limits, and other exceptions to support rapid troubleshooting
- Model calls logging: Tracks all model interaction details across workflows
Data Export Based on the OpenTelemetry Standard
TraceLLM's most noteworthy design choice is that it doesn't invent a proprietary protocol. Instead, it adopts the industry-standard OpenTelemetry (OTLP) protocol for exporting trace data.
OpenTelemetry (OTel for short) is an open-source observability framework hosted by the Cloud Native Computing Foundation (CNCF). It was formed by merging the OpenTracing and OpenCensus projects and officially launched in 2019. Its core goal is to provide a vendor-neutral set of standardized APIs, SDKs, and toolchains for generating, collecting, and exporting telemetry data (Traces, Metrics, Logs). OTLP (OpenTelemetry Protocol) is its defined data transmission protocol, supporting both gRPC and HTTP transport methods. As of 2024, OTel has become the second most active project in CNCF after Kubernetes, with support from major cloud vendors including Google, Microsoft, Amazon, and Splunk. Virtually all mainstream observability backends natively support OTLP data ingestion.
This means teams can seamlessly integrate LLM trace data with their existing observability infrastructure—whether they use Jaeger, Grafana Tempo, or commercial platforms like Datadog or Honeycomb. This "embrace the standard" strategy reduces migration and integration costs while avoiding vendor lock-in, which is a major advantage for an open-source tool.
Why Building LLM Monitoring on OpenTelemetry Is a Smart Move
OpenTelemetry has become the de facto standard in cloud-native observability, incubated by CNCF with broad ecosystem support. Several LLM observability tools have emerged on the market, such as LangSmith, Langfuse, and Helicone, each with different focuses but varying levels of ecosystem compatibility.
Looking at the competitive landscape in detail: LangSmith is the official tracing platform from LangChain, deeply coupled with the LangChain framework—suitable for teams already using LangChain but carrying vendor lock-in risk. Langfuse is an open-source alternative offering Prompt management and evaluation features—fairly comprehensive but requiring self-deployment of the full backend. Helicone focuses on request logging and cache optimization at the LLM proxy layer. Arize Phoenix specializes in model evaluation and drift detection. Commercial APM vendors like Datadog and New Relic have also launched AI monitoring modules. TraceLLM's differentiated positioning is that it doesn't try to be a full-featured platform. Instead, it focuses on doing "trace data collection + OTLP standard export" well, letting data flow into users' existing observability backends. This Unix philosophy of "do one thing well" often has greater vitality in open-source communities.
By choosing OTLP as its data export format, TraceLLM essentially "translates" LLM trace data into a language the entire observability industry can understand. For engineering teams that have already built mature monitoring systems, this means they don't need to maintain a separate, siloed monitoring stack for AI applications. Instead, they can incorporate LLM Spans into their existing distributed tracing views, achieving unified end-to-end observation.
This is especially important in microservice architectures: when a single user request might traverse a gateway, business services, a vector database, and then an LLM call, only a unified tracing standard can piece together the complete call panorama.
Use Cases and Future Outlook for TraceLLM
From a product positioning perspective, TraceLLM targets engineering teams that have already deployed AI applications to production, rather than developers still in the experimentation phase. The core problem it solves is "detecting bottlenecks before they impact users," which aligns closely with SRE (Site Reliability Engineering) principles.
SRE is an engineering practice first created by Google in 2003, with the core philosophy of solving operations problems through software engineering methods. Key SRE concepts include SLI (Service Level Indicator), SLO (Service Level Objective), and Error Budget. Applying SRE principles to AI applications means defining AI-specific SLIs, such as: P99 latency not exceeding 3 seconds, Token cost month-over-month growth not exceeding 20%, model call success rate ≥ 99.5%, and output quality scores (via automated evaluation) ≥ threshold. Observability is the prerequisite for achieving these goals—without measurement, there is no improvement. The trace data provided by TraceLLM is the foundational input for building an AI application SLO system.
As an open-source project, its value lies not only in its features but also in promoting the concept that "LLM observability should follow open standards." As AI applications scale to production, cost control, stability assurance, and performance optimization will become everyday concerns for engineering teams—and observability is the infrastructure that underpins all of this.
Of course, as a newly launched tool, TraceLLM still needs validation in terms of ecosystem maturity, integration documentation, and community support. Interested developers can explore implementation details through its GitHub repository and evaluate whether it's suitable for their technology stack.
For teams struggling with the "black box" problem of AI applications, TraceLLM offers at least one option that's based on open standards and under their own control.
Related articles

A Developer's Hands-On Test of Doubao Phone Assistant: AI Phones Are Evolving from Chatbot to Agent
A developer's hands-on test of Doubao Phone Assistant — from screen Q&A and calendar actions to server port checks and FFmpeg vulnerability patching — exploring how AI phones evolve from Chatbot to Agent.
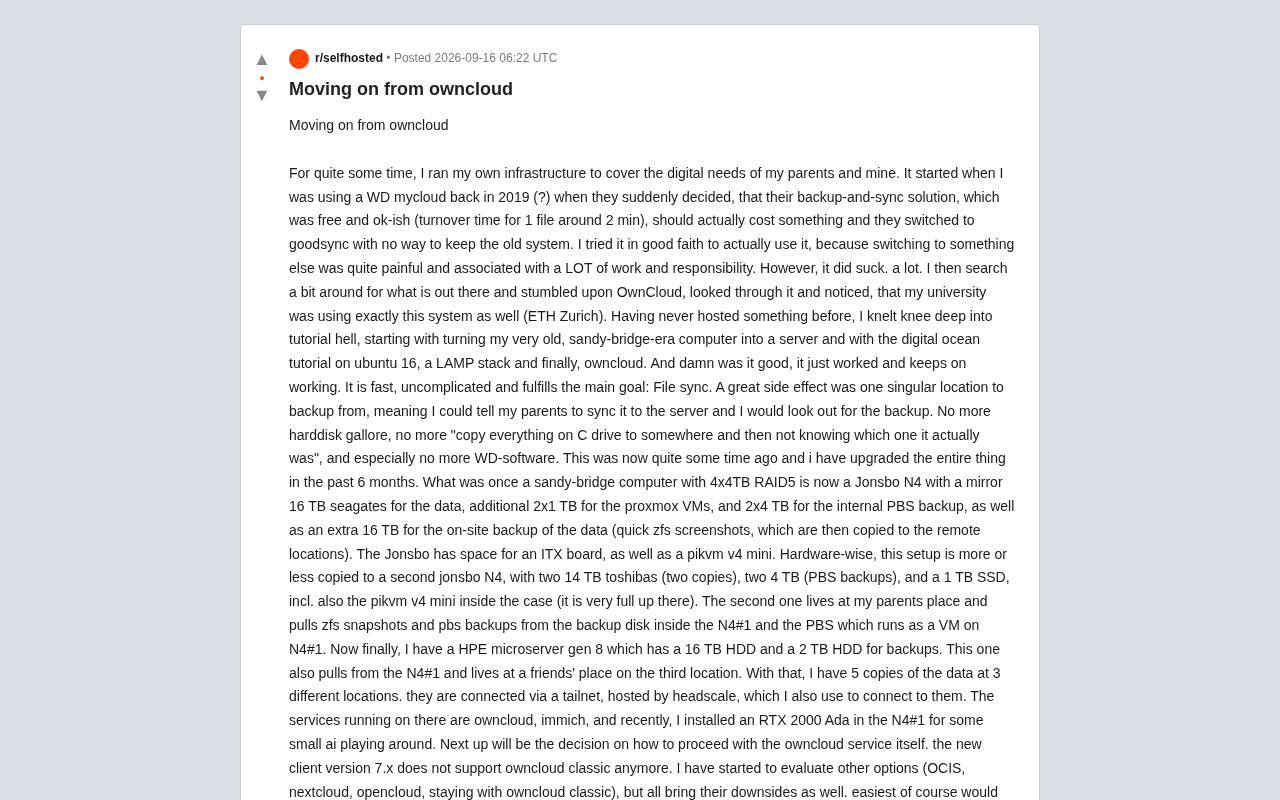
Moving On from ownCloud: Building a 5-Copy, 3-Location Home NAS Backup System
A Reddit user's journey from WD MyCloud to a 5-copy, 3-location ZFS+Proxmox home NAS, and the hard choices facing ownCloud Classic users as the official client drops support.
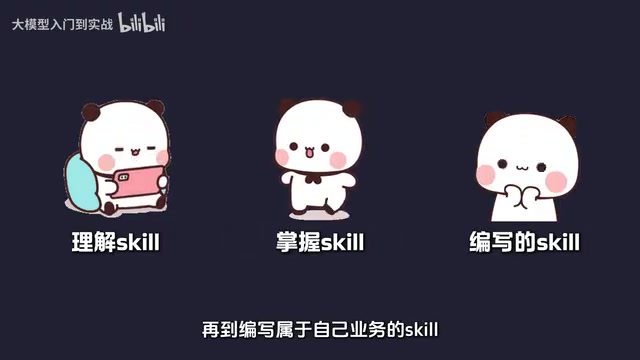
What Are Agent Skills? A Beginner's Guide from Understanding to Customization
What are Agent Skills? This guide breaks down the Skill concept, its role in ecosystems like Claude Code, and a three-step learning path from understanding to customization.