Vessel: A Local LLM Observability Proxy for Request Capture and Cross-Model Replay Comparison

Vessel is an open-source local LLM observability proxy for request capture and cross-model replay comparison.
Vessel is a free, open-source observability proxy for local LLMs that sits in front of inference backends like Ollama, LM Studio, and vLLM. It automatically captures all requests, provides precise token statistics and cold-load detection, and offers a standout cross-model replay feature for side-by-side comparison. With a built-in MCP server, Web UI, zero-dependency single-binary deployment, and no telemetry under MIT license, it fills a critical observability gap in the local LLM toolchain.
Running large language models (LLMs) locally has become an increasingly popular choice among developers, but it comes with a real pain point: when multiple AI Agents are calling Ollama simultaneously, you have no idea what they're actually sending, how many tokens they're consuming, or how fast the responses are. Recently, a developer shared his open-source project Vessel on Reddit — an observability proxy built specifically for local LLMs, designed to fundamentally solve this "black box" problem.
Why Local LLMs Need an Observability Proxy
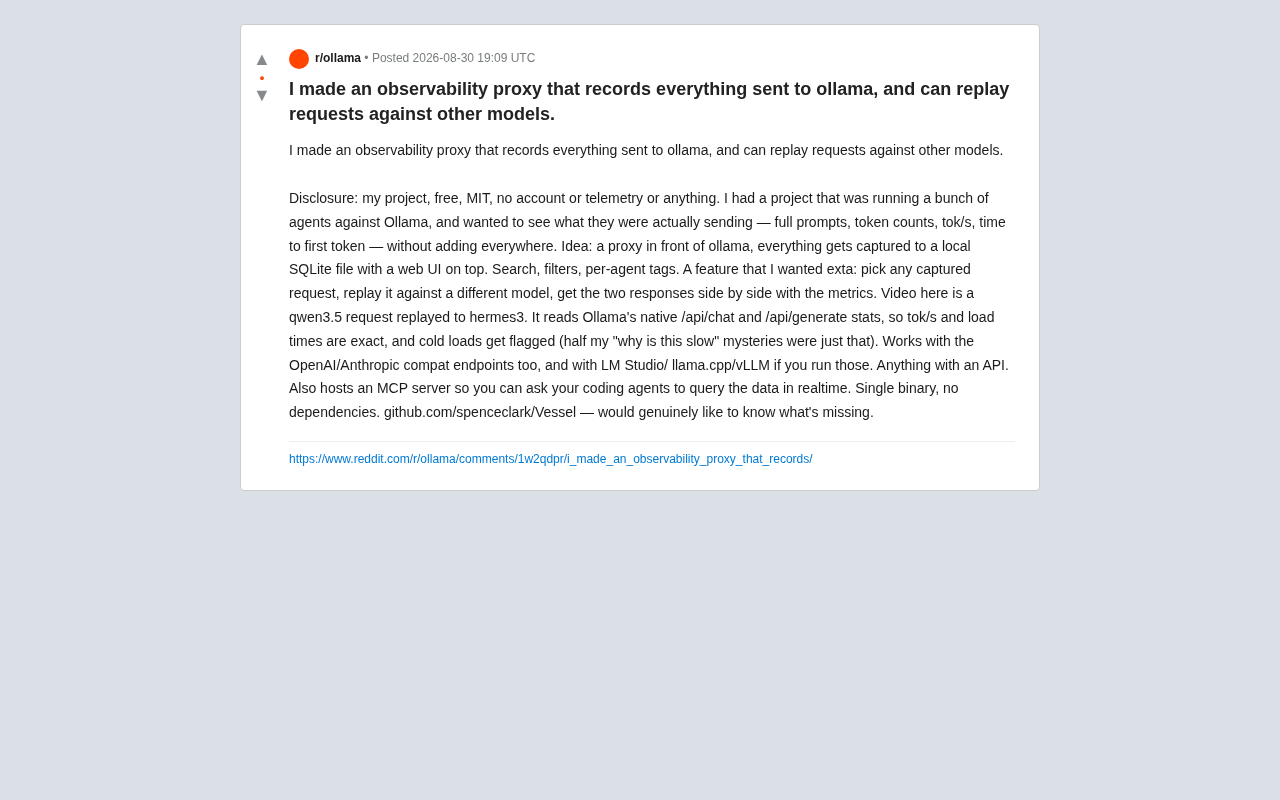
The project author (GitHub user spenceclark) described the real-world scenario he encountered: he had a project running a bunch of Agents on Ollama but had absolutely no way to see what those Agents were actually doing — what the full prompts looked like, how many tokens were used, how many tokens per second (tok/s) were generated, or what the time to first token was.
Ollama is one of the most popular frameworks for running LLMs locally. It wraps model downloading, quantization, and inference serving into a Docker-like streamlined experience, allowing users to pull and run models with a single command. Under the hood, Ollama is built on the llama.cpp inference engine and supports GGUF-format quantized models, enabling efficient execution of open-source models ranging from 7B to 70B parameters on consumer-grade hardware. Its RESTful API (including the /api/chat and /api/generate endpoints) is compatible with OpenAI's API format, allowing many applications built with the OpenAI SDK to migrate to local execution at zero cost. However, Ollama itself doesn't offer rich monitoring or logging capabilities — and that's exactly the gap Vessel aims to fill.
The traditional approach is to manually add logging instrumentation at every call site, which is not only tedious but also hard to maintain. The author's approach is far more elegant: place a proxy layer in front of Ollama that automatically captures all passing requests and stores them in a local SQLite file, paired with a Web UI for visual management.
This "transparent proxy interception" design pattern has a long history in software engineering. A transparent proxy is a classic network architecture pattern where a proxy server sits between the client and the target server, forwarding all requests and responses while recording, analyzing, or even modifying the traffic. Similar approaches are widely used in web development — Charles Proxy and mitmproxy for HTTP debugging, Envoy and Nginx for traffic management in service meshes. The biggest advantage of this pattern is that it's completely transparent to both client and server — no business code needs to be modified; you just change the connection address. Vessel brings this mature architectural pattern into the LLM observability space, meaning developers can gain full-stack observability without modifying any existing code — they just need to point their request address to the Vessel proxy. For debugging complex multi-Agent systems, this is a remarkably pragmatic solution.
It's worth providing some background on the concept of "observability" here. Observability originates from control theory and refers to the ability to infer a system's internal state from its external outputs. In modern distributed systems, observability typically encompasses three pillars: Logs, Metrics, and Traces. Unlike traditional monitoring, which focuses on "known unknowns," observability emphasizes helping developers discover "unknown unknowns." In LLM applications, observability is especially critical — the behavior of large language models is non-deterministic, and the same prompt can produce vastly different outputs under different contexts. Without complete request records and performance metrics, debugging is virtually impossible.
Vessel Core Features: Request Capture, Search, and Cross-Model Replay
Full LLM Request Capture with Precise Statistics
Vessel reads the native statistics from Ollama's /api/chat and /api/generate endpoints, so the tok/s and model load times it reports are exact values, not estimates. The author specifically highlighted a practical detail: the tool flags "cold loads" — half of his "why is this so slow" mysteries turned out to be just the model cold-loading.
Understanding "cold loads" is crucial for local LLM users. In Ollama's runtime mechanism, models don't always reside in VRAM or memory. When a model hasn't been called for an extended period, or when other models need the VRAM resources, Ollama will unload the current model from VRAM. When an inference request for that model comes in again, the system needs to reload several GB or even tens of GB of model weights from disk into VRAM — this process is a "cold load." For a 7B quantized model, cold loading might take several seconds; for a 70B-class model, the wait can stretch to tens of seconds. If developers aren't aware of this mechanism, they can easily misattribute cold-load latency to slow model inference speed, leading to incorrect model selection decisions. Vessel's explicit flagging of cold load status helps developers accurately distinguish between model loading latency and actual inference latency, which has high practical value in performance tuning.
Captured data supports search, filtering, and per-agent tags, making it easy to quickly locate target requests among many.
Cross-Model Replay Comparison
This is Vessel's most noteworthy differentiating feature: you can select any captured request and replay it to a different model, then display both models' response results and performance metrics side by side.
The author demonstrated replaying a qwen3.5 request to hermes3 in the demo video. This feature is extremely valuable for model selection, performance comparison, and cost evaluation — you no longer need to manually copy-paste prompts to test models one by one. Instead, you can run A/B comparisons directly based on real production traffic. In traditional model evaluation workflows, developers typically need to build dedicated evaluation datasets, write test scripts, and manually collect and compare results — a time-consuming process that easily misses edge cases. Vessel's replay feature lets developers compare models directly using real request data from actual business scenarios, yielding evaluation results that more closely reflect real-world usage.
Broad Compatibility and Integration Capabilities
Although Vessel was originally designed for Ollama, its applicability extends far beyond:
-
Compatible with multiple inference backends: Supports OpenAI and Anthropic compatible endpoints, as well as local inference frameworks like LM Studio, llama.cpp, and vLLM. In the author's own words: "Anything with an API" — if it has an API, it can theoretically be connected. These inference backends each have their strengths: LM Studio offers a friendly GUI suitable for beginners; llama.cpp is the underlying inference engine providing maximum flexibility and optimal performance tuning; vLLM is known for technologies like PagedAttention and excels in high-concurrency batch inference scenarios. Vessel's multi-backend compatibility allows developers to freely switch between and compare different inference solutions under a unified observability platform.
-
Built-in MCP Server: Vessel also hosts an MCP (Model Context Protocol) server, meaning you can have your coding Agent query captured observability data in real time. MCP is an open protocol released by Anthropic in late 2024, designed to standardize how AI models interact with external data sources and tools. It uses a client-server architecture and defines three core primitives — Resources, Tools, and Prompts — enabling AI Agents to discover and invoke external capabilities in a unified way. Vessel's built-in MCP server means AI Agents can proactively query their own and other Agents' runtime metrics — for example, a "supervisor" Agent can monitor other Agents' token consumption and response latency in real time, dynamically adjusting task allocation strategies. This enables a kind of "AI monitoring AI" metacognitive capability, which is significant in autonomous multi-Agent systems.
-
Single binary, zero-dependency deployment: The entire tool is packaged as a single binary file with no dependencies to install, making the deployment barrier extremely low.
Open Source, Free, No Telemetry, Privacy-Safe
The author made a clear declaration upfront: this is his personal project, completely free under the MIT license, requiring no account registration, with no telemetry or data collection whatsoever. For local LLM users who prioritize privacy and data security, this is especially important — after all, one of the primary motivations for local deployment is keeping data from leaking.
The "no telemetry" commitment is particularly valuable in today's developer tools landscape. In recent years, several open-source tools have triggered trust crises after being discovered secretly collecting user data. The MIT license, as one of the most permissive open-source licenses, allows users to freely use, modify, and distribute the code — meaning teams with higher security requirements can audit the code themselves to confirm no data exfiltration exists. All captured request data is stored as SQLite files on local disk, never passing through any third-party servers, with data sovereignty completely in the user's hands.
The project is hosted on GitHub at spenceclark/Vessel. The author was also very candid at the end of his post: "I genuinely want to know what's missing," welcoming community feedback.
Filling the Observability Gap in the Local LLM Toolchain
As the local LLM ecosystem matures, tools for model inference, Agent frameworks, and UI frontends are proliferating, but observability remains a relatively weak link. Cloud APIs come with built-in dashboards from their respective platforms, while local deployments often leave developers to build their own monitoring.
In the cloud LLM observability space, a number of mature tools have emerged: LangSmith (developed by the LangChain team) offers comprehensive LLM application tracing and evaluation capabilities; Helicone focuses on API call logging and cost analysis; Langfuse provides LangSmith-like functionality with an open-source approach. However, most of these tools are designed for cloud API call scenarios and default to sending data to the cloud for analysis. For users who choose to deploy LLMs locally, using these cloud observability tools somewhat defeats the purpose of local deployment.
Vessel's value lies in using the lightweight combination of "transparent proxy + local storage + Web UI" to give local LLMs capabilities similar to professional APM (Application Performance Monitoring), while maintaining a local-first, privacy-safe philosophy. APM is core infrastructure in enterprise software development — products like Datadog, New Relic, and Dynatrace automatically collect key metrics such as request latency, throughput, and error rates by embedding probes at the application layer or using proxy interception, providing visualization dashboards and alerting capabilities. Vessel brings this proven monitoring paradigm into the local LLM ecosystem, and its "cross-model replay comparison" and "MCP integration" features in particular go beyond what ordinary logging tools offer, demonstrating a deep understanding of real development pain points.
For developers building multi-Agent systems or needing to frequently compare model options, Vessel is a tool worth trying. Of course, as a new project, its stability, performance under large-scale data, and community ecosystem still need time to prove themselves.
Related articles

Apple Watch ECG Detects Atrial Fibrillation, Saves Triathlete's Life: A Real-World Story
Triathlete Connor's heart rate spiked to 219 bpm during a race. His Apple Watch ECG detected AFib, leading to open-heart surgery that fixed a hidden heart condition.

Norcross Maine Forest Fire Maps: A Century-Old Cartographic Legacy and Data Visualization Pioneer
Explore Archie G. Norcross's 1918–1922 Maine forest fire maps—a hand-drawn cartographic masterpiece that pioneered early data visualization and remains valuable for climate research, historical GIS, and AI fire monitoring.

Apogee: A Privacy-First Browser Summarization Extension Rebuilt with Local AI After Mozilla Killed Orbit
After Mozilla killed Orbit, an indie developer rebuilt a fully local AI browser summarization extension called Apogee using Ollama, WebGPU, and Transformers.js—no user data ever leaves your device.